Throwing Shapes
Probability Distribution
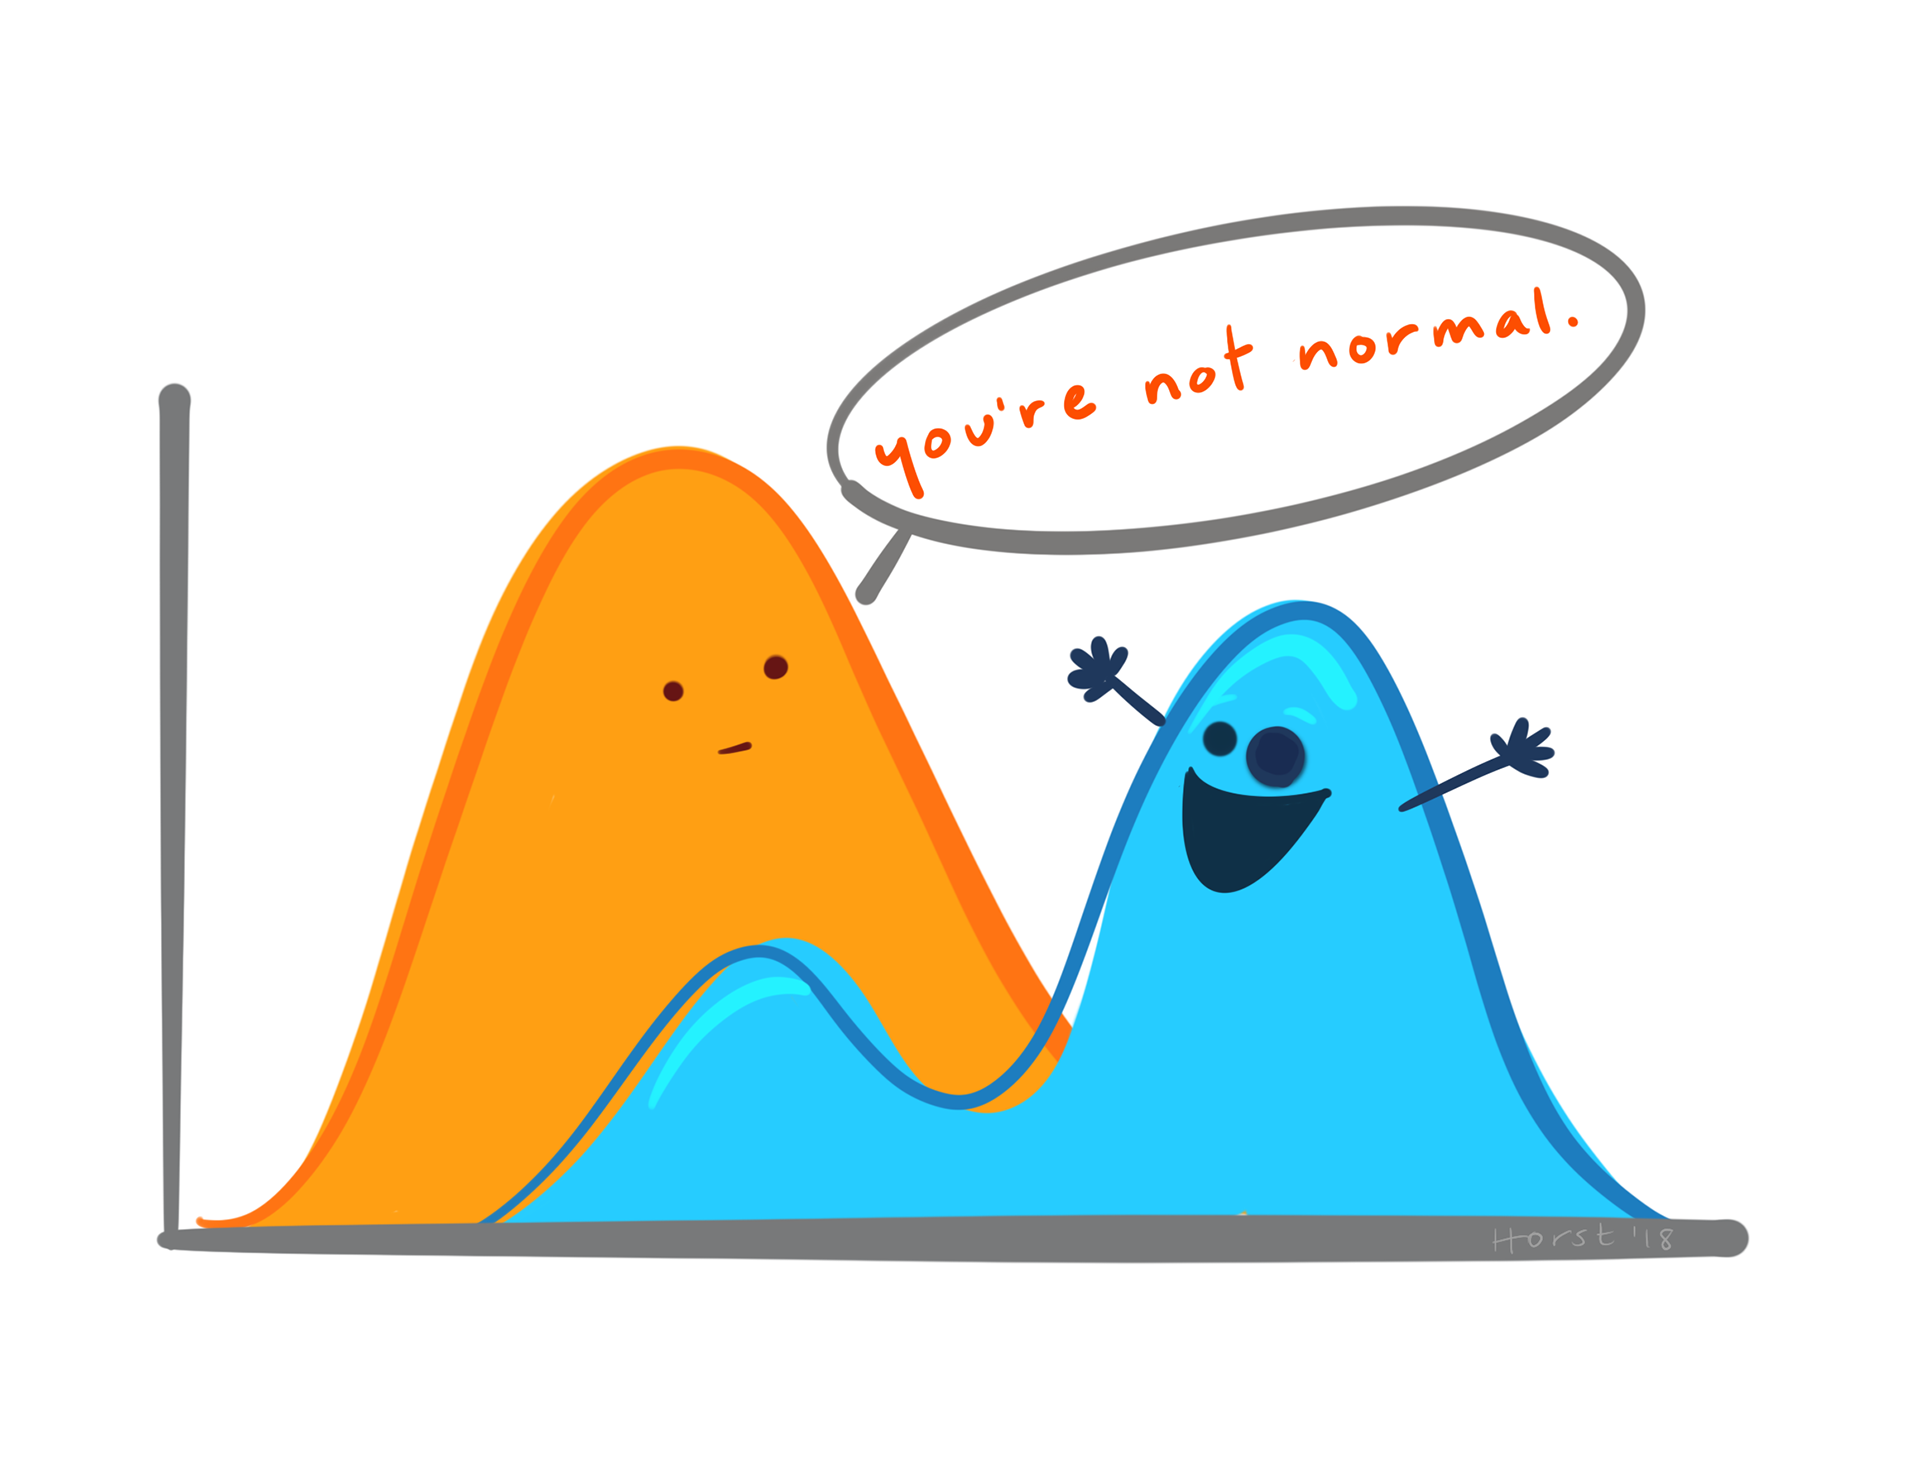
Symmetrical/Normal Distribution
The curve is symmetrical if we draw a vertical line through the centre of the distribution then it looks the same on both sides.
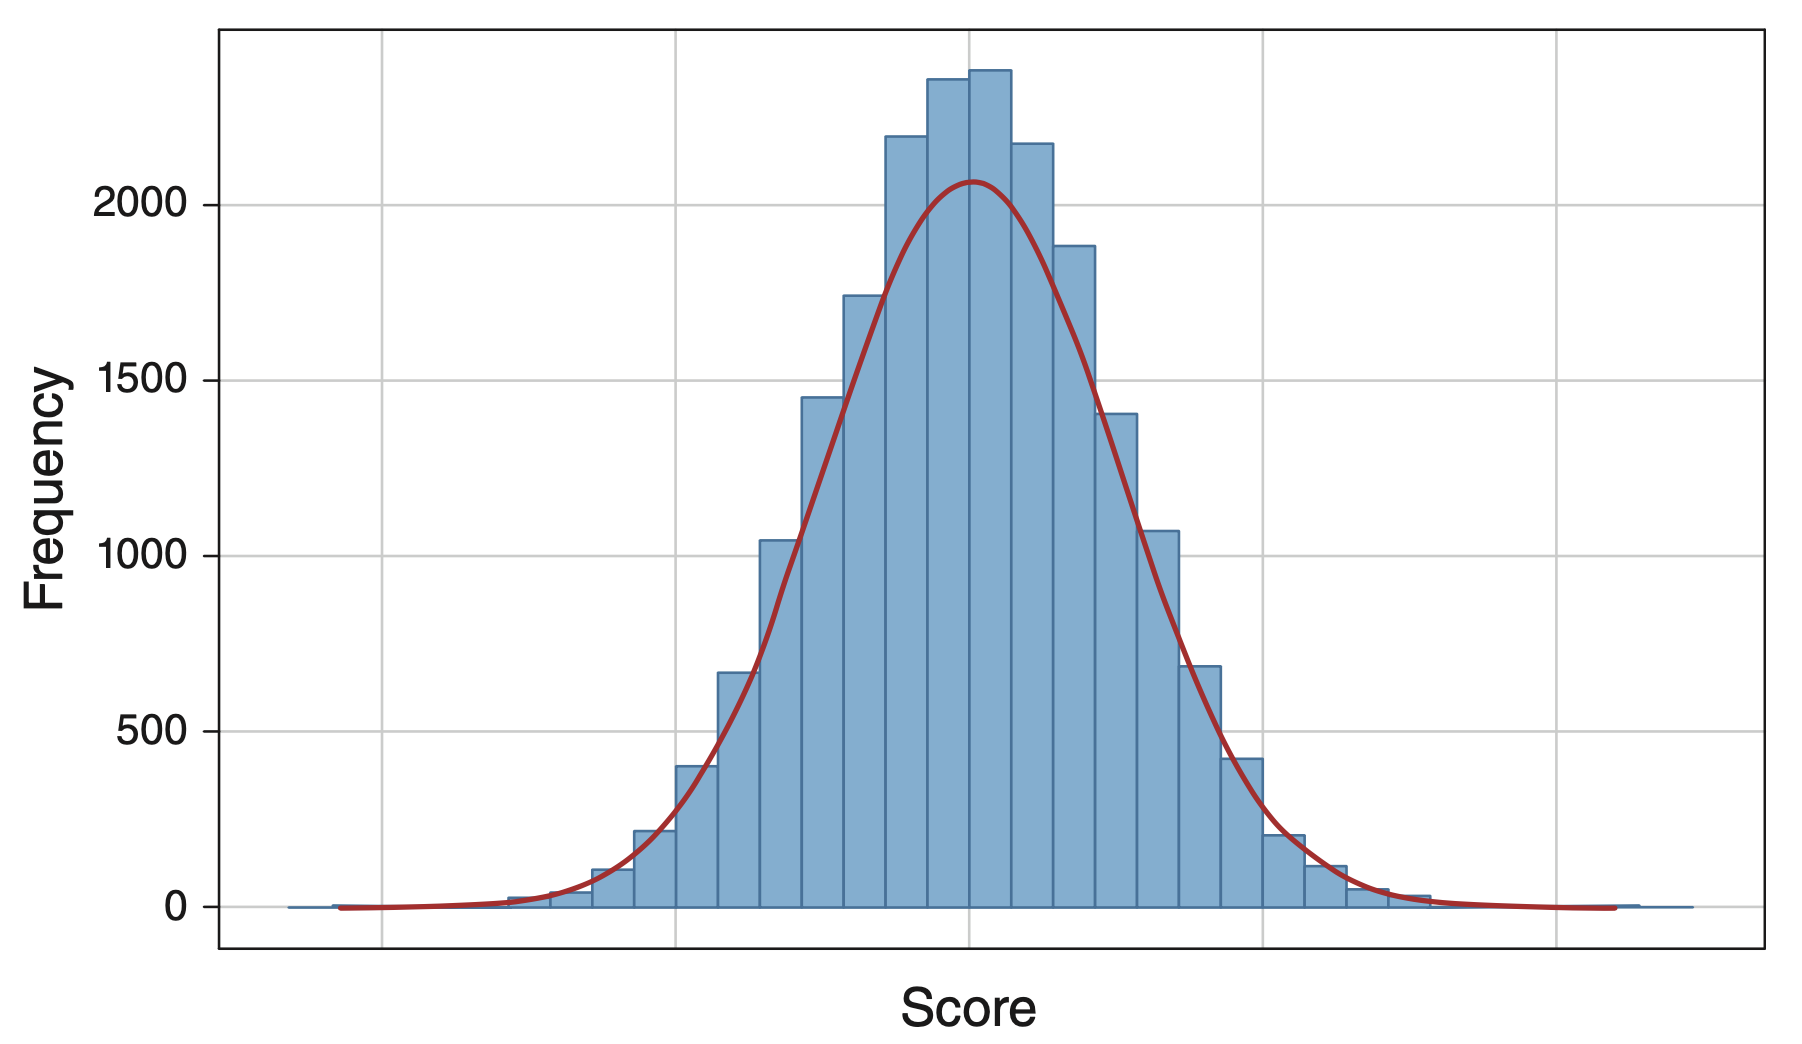
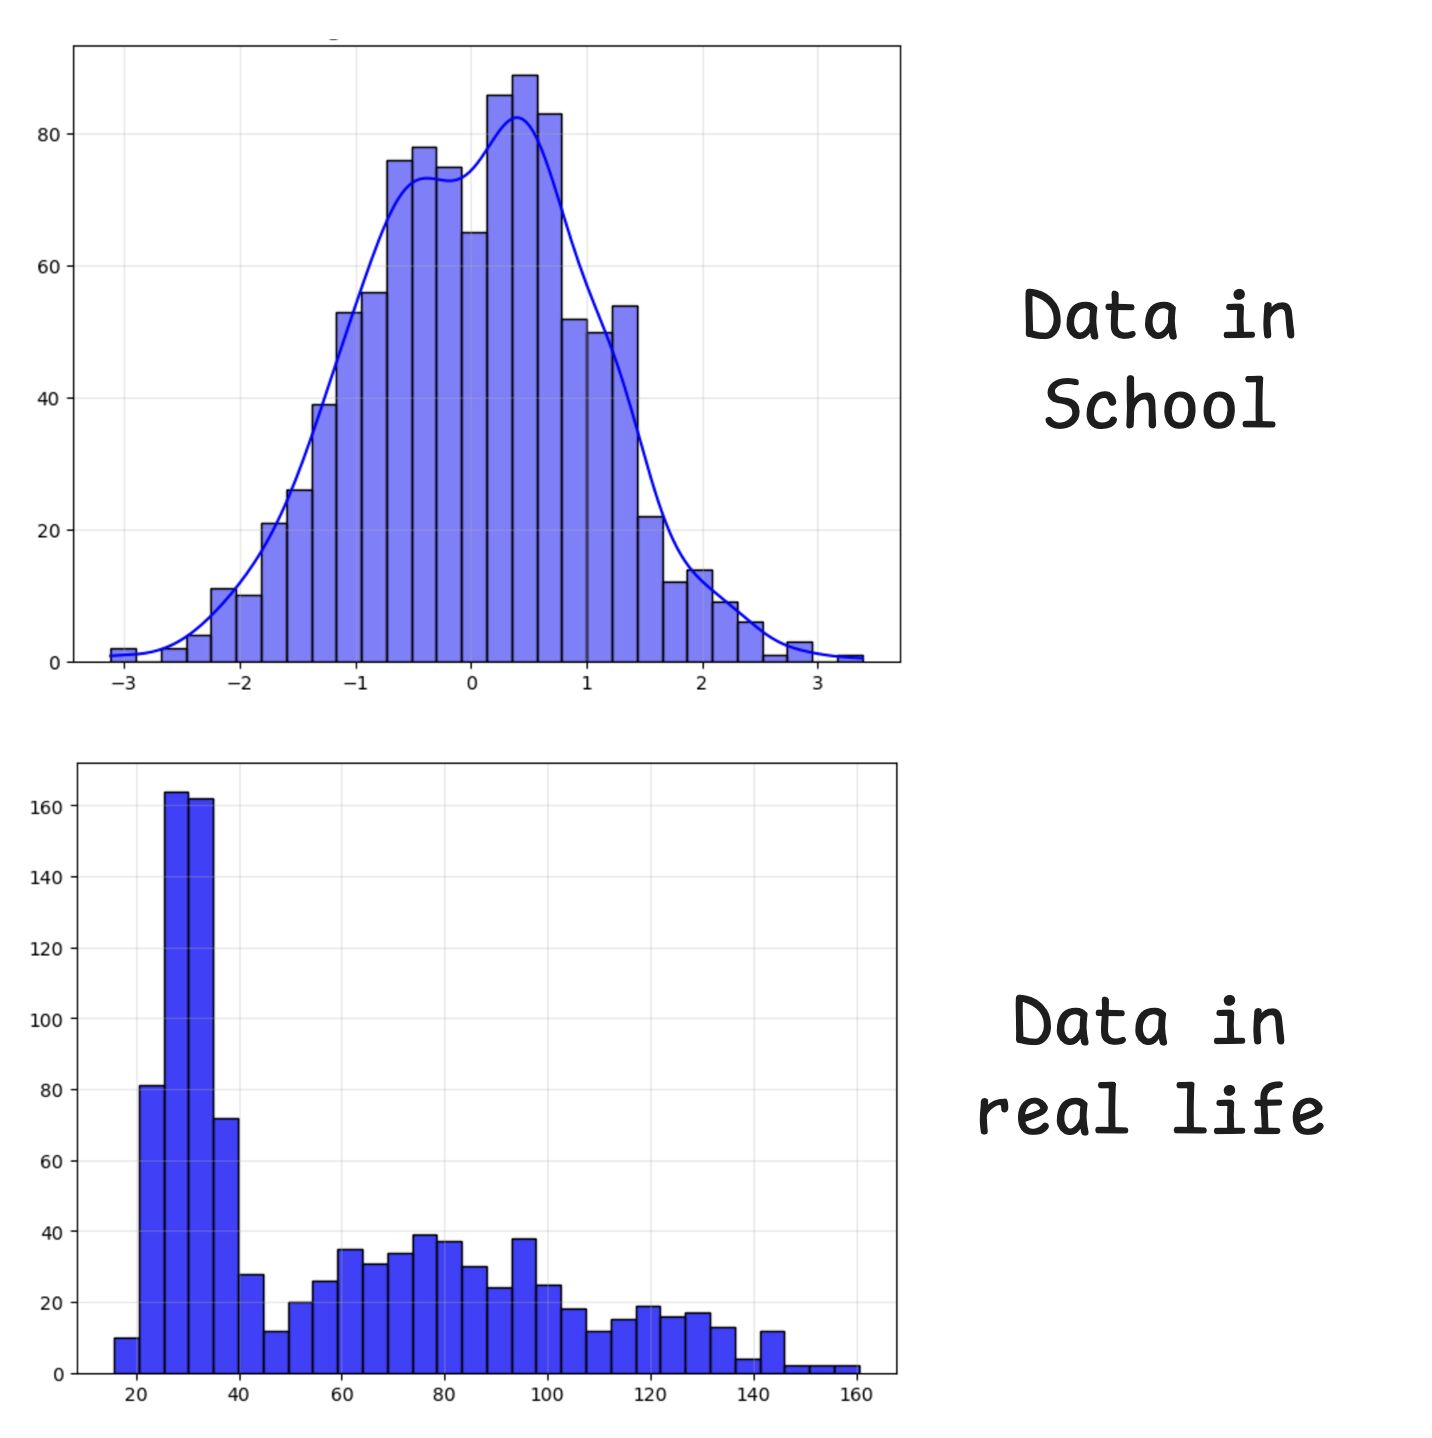
All Distributions are not “normal”
Real Life Data
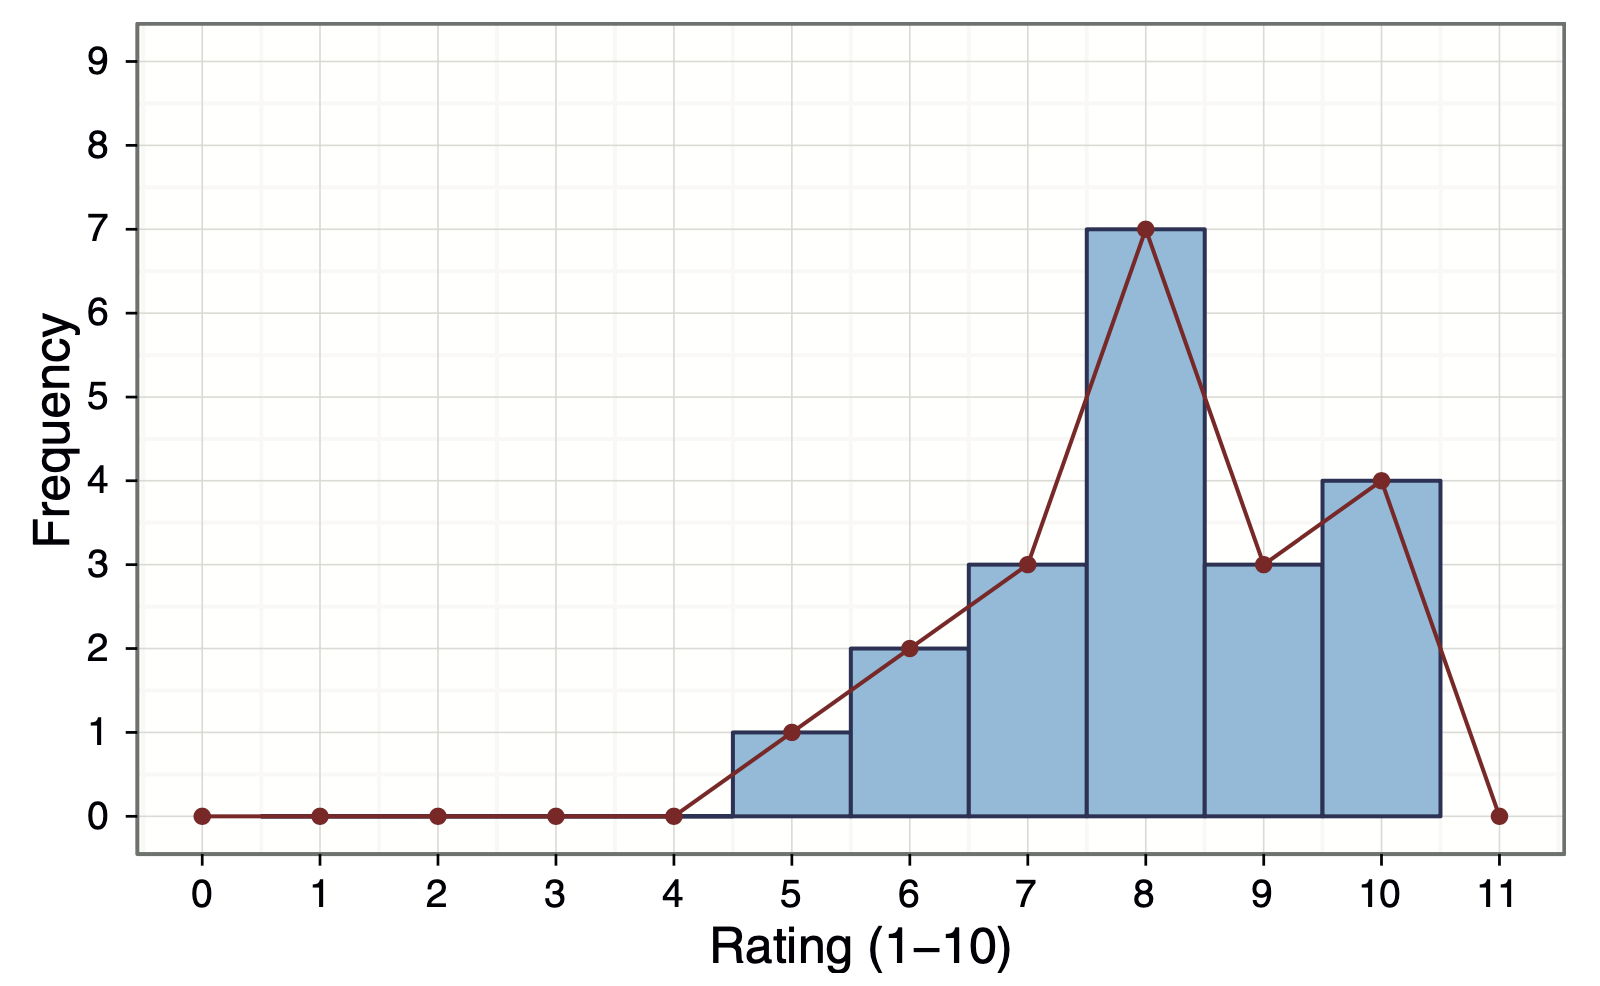
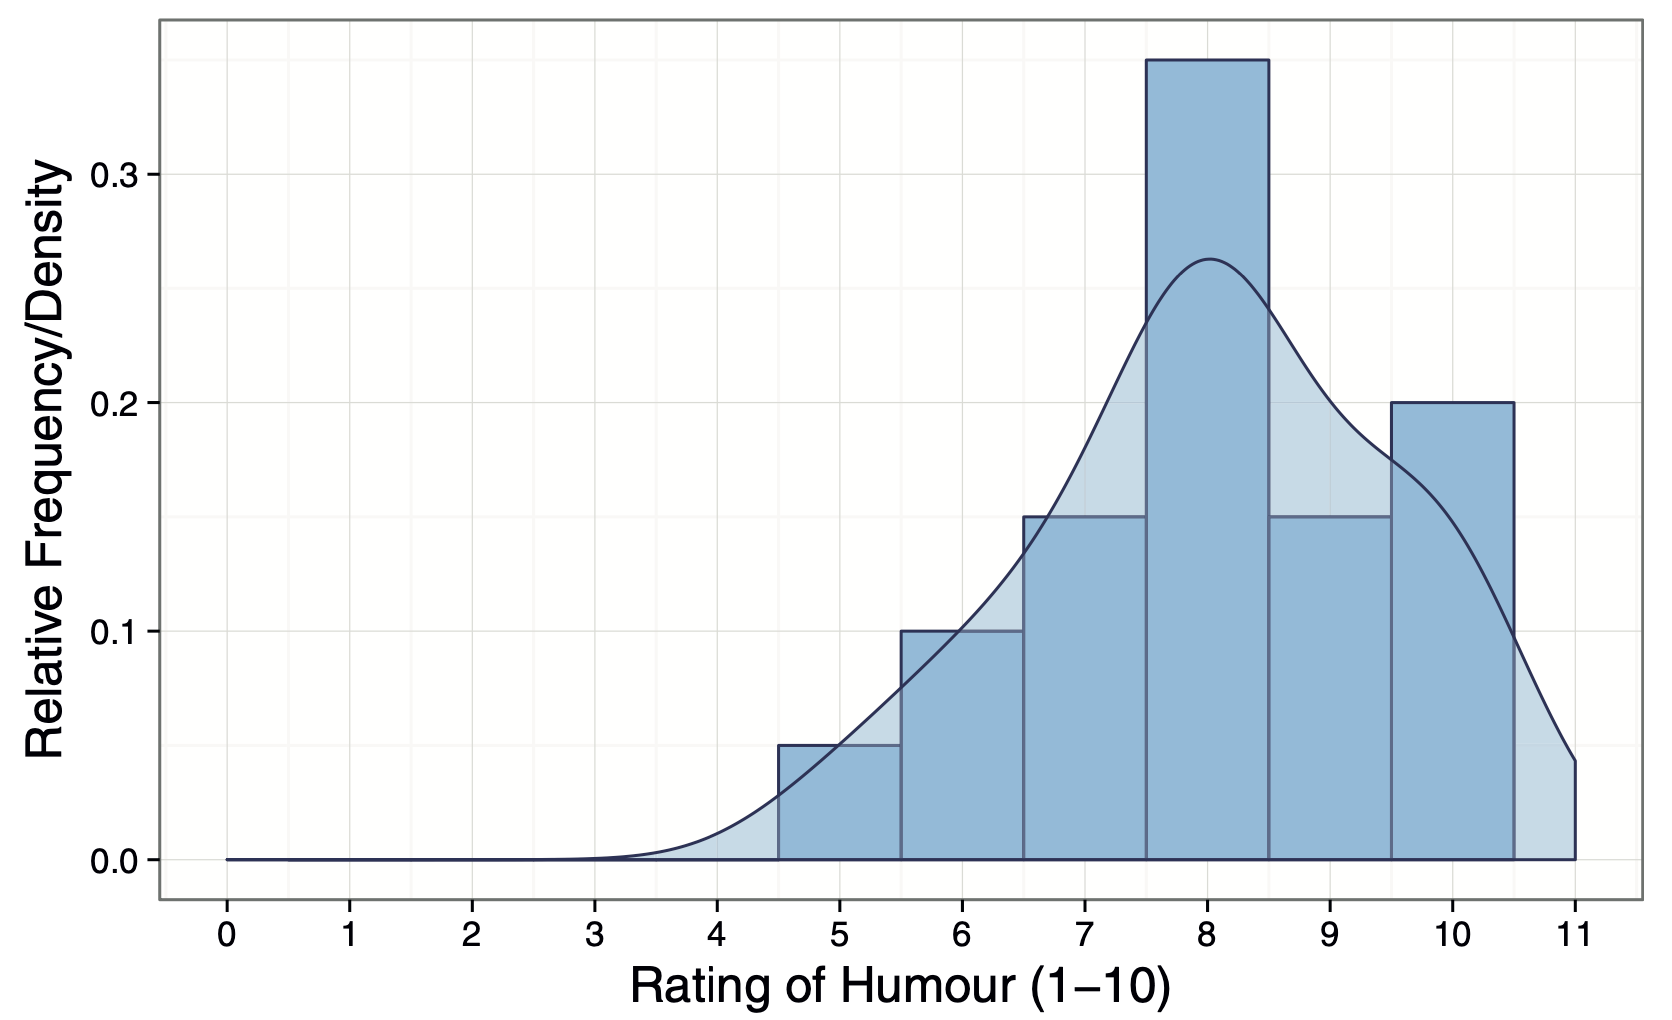
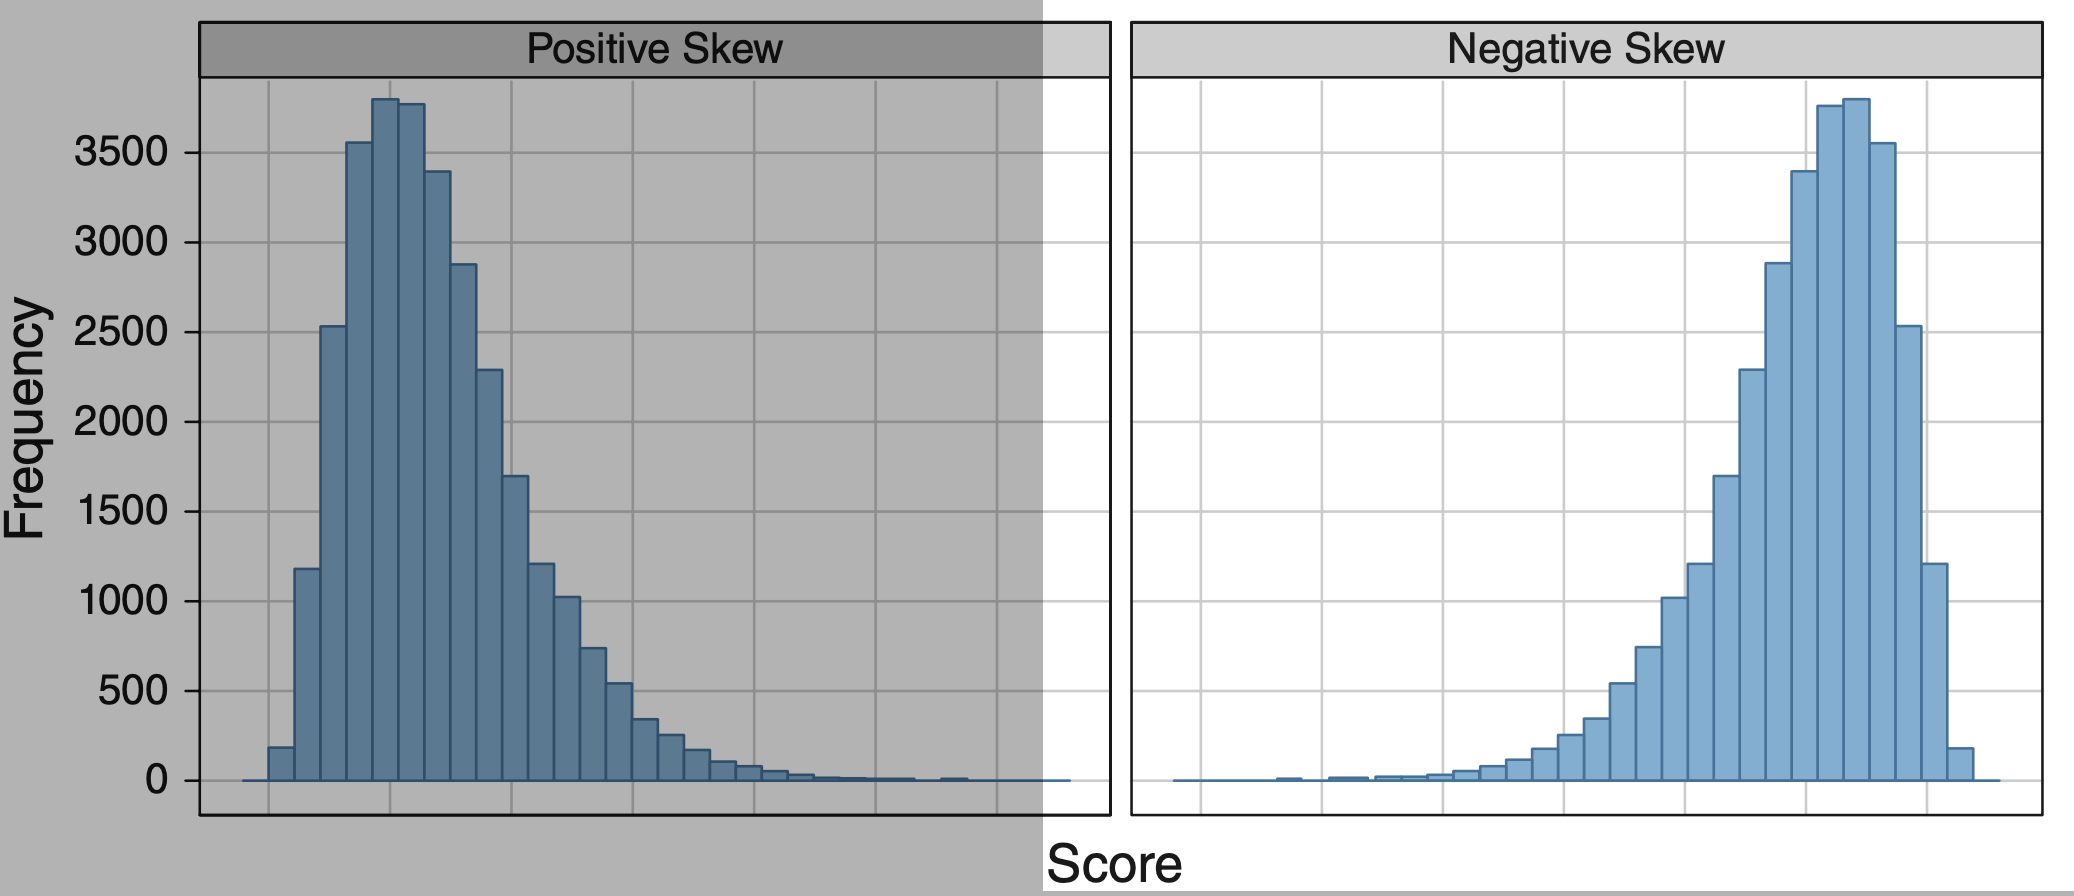
Skewness
Skewness measures the asymmetry of a distribution around its mean.
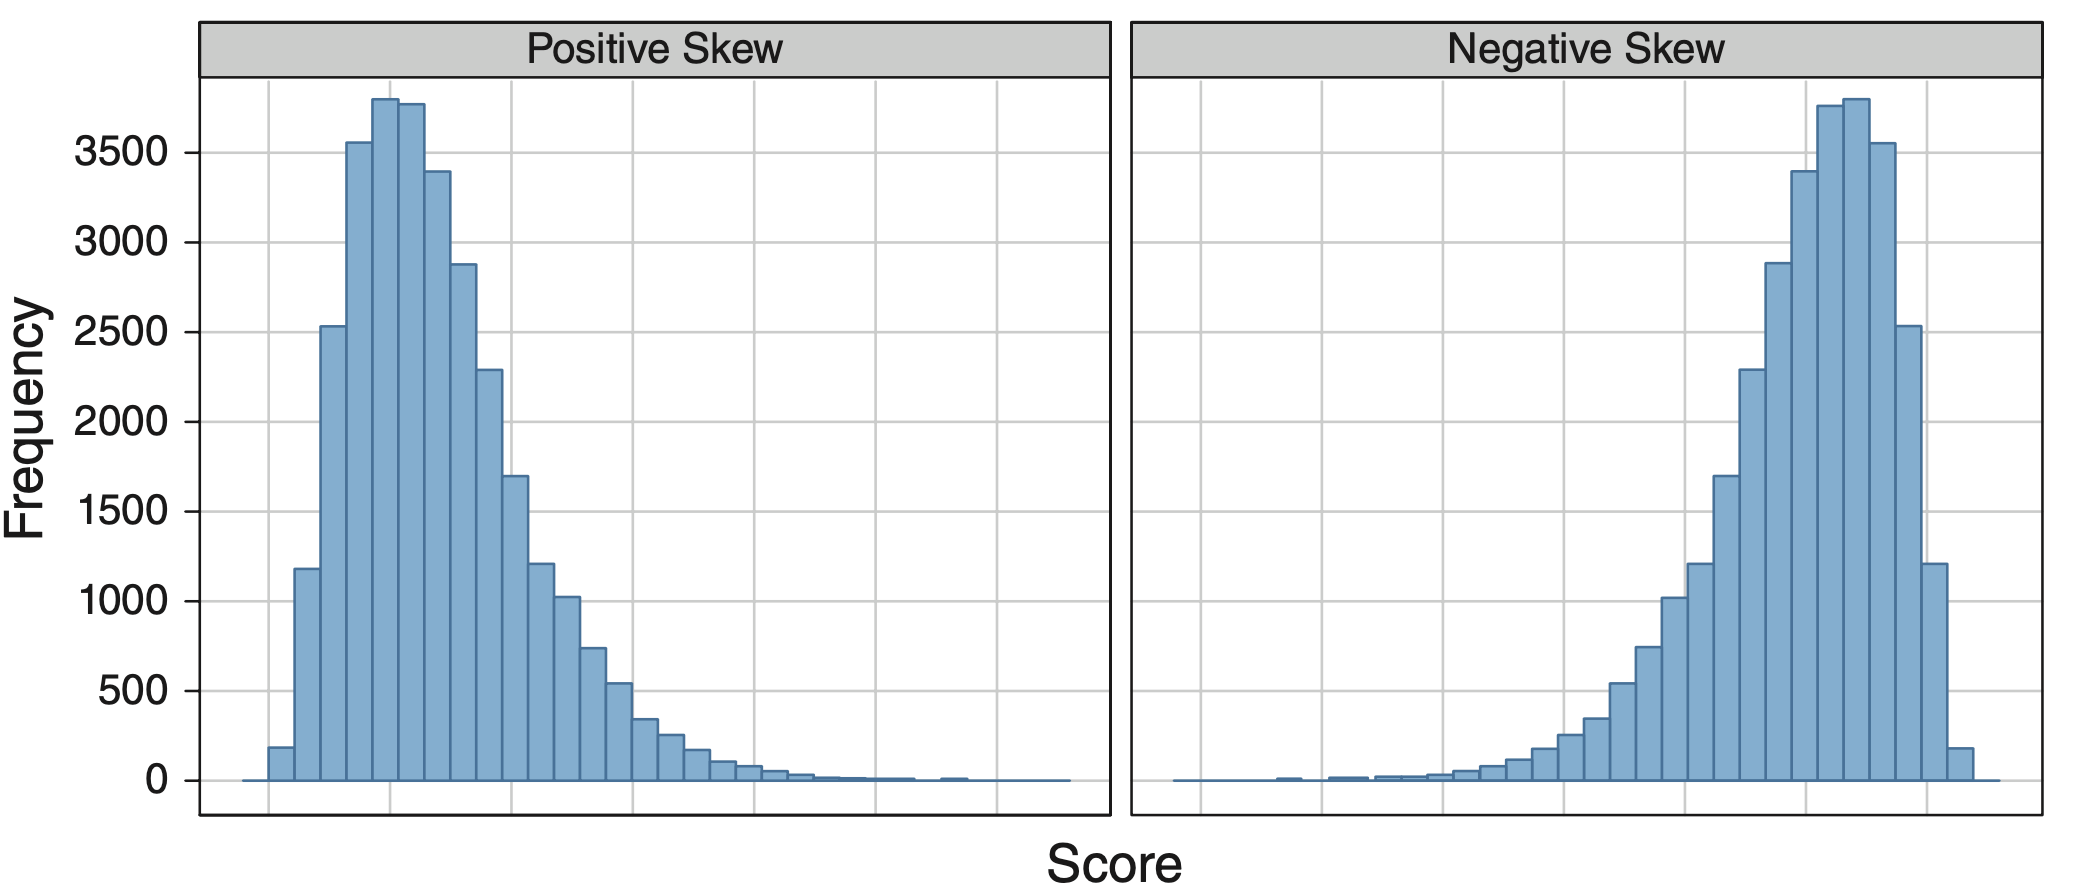
Positive Skew
“A longer tail on the right side.”
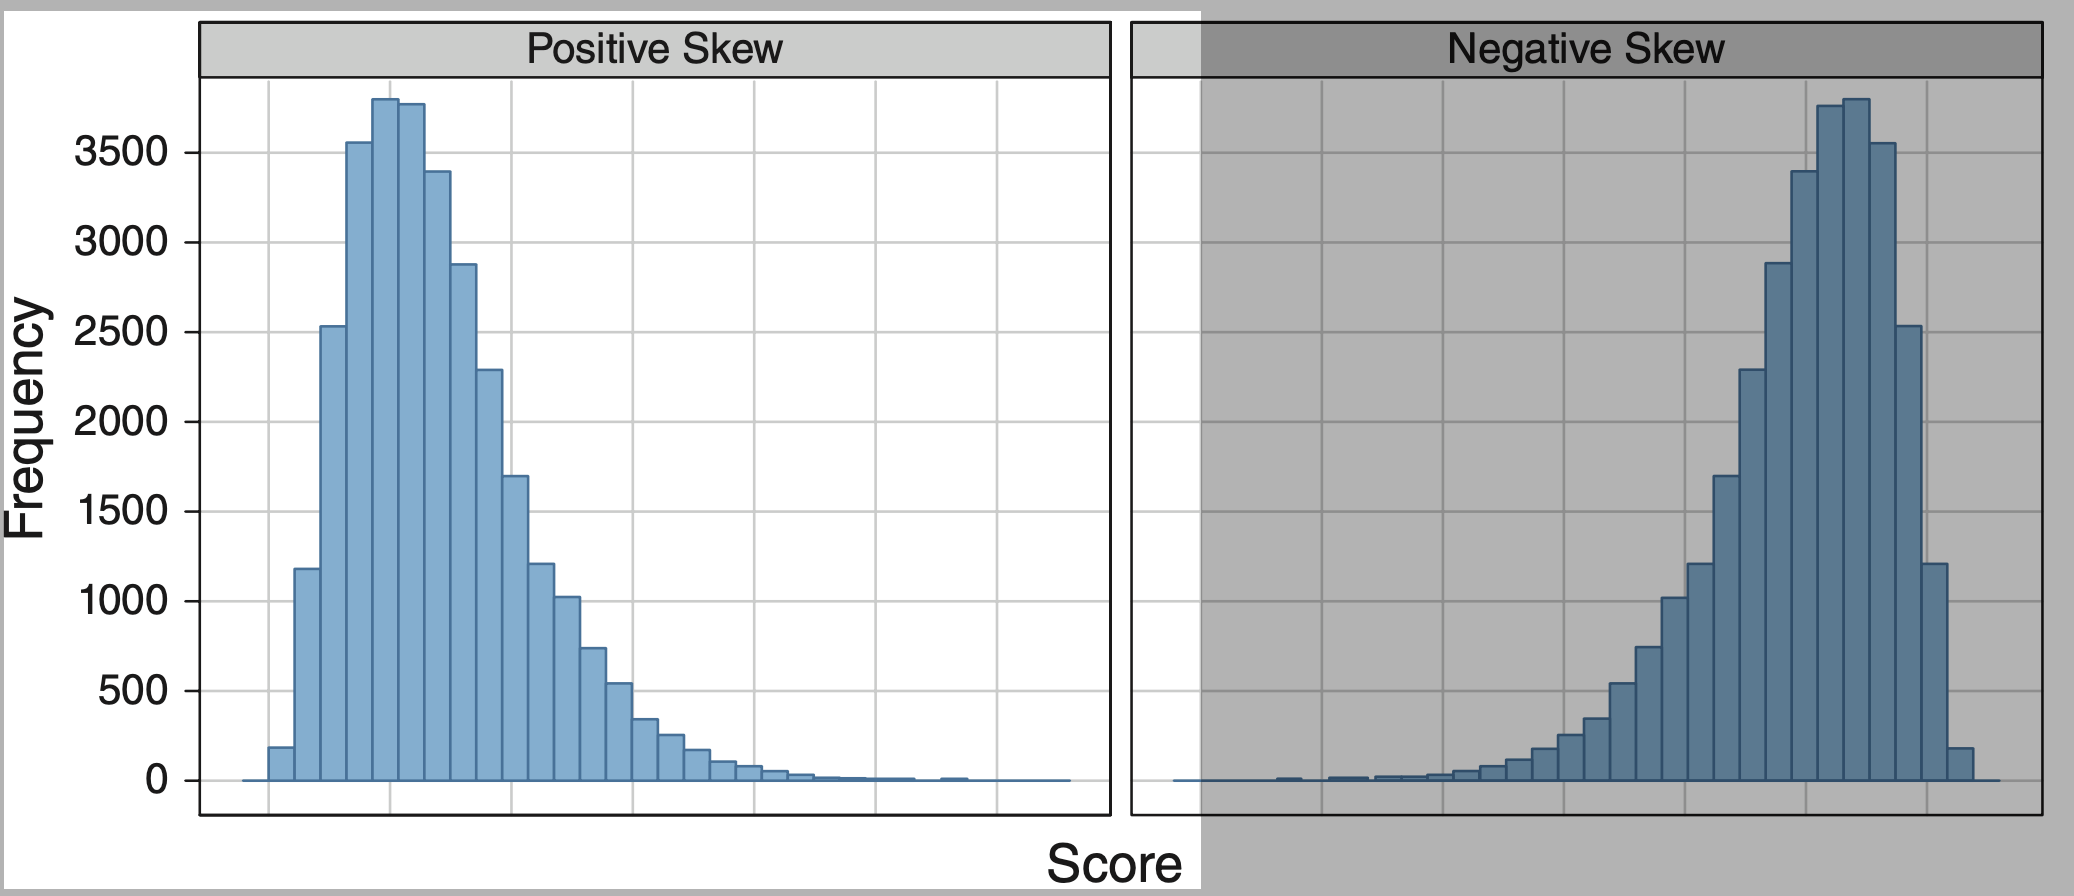
Negative Skew
A longer tail on the left side.
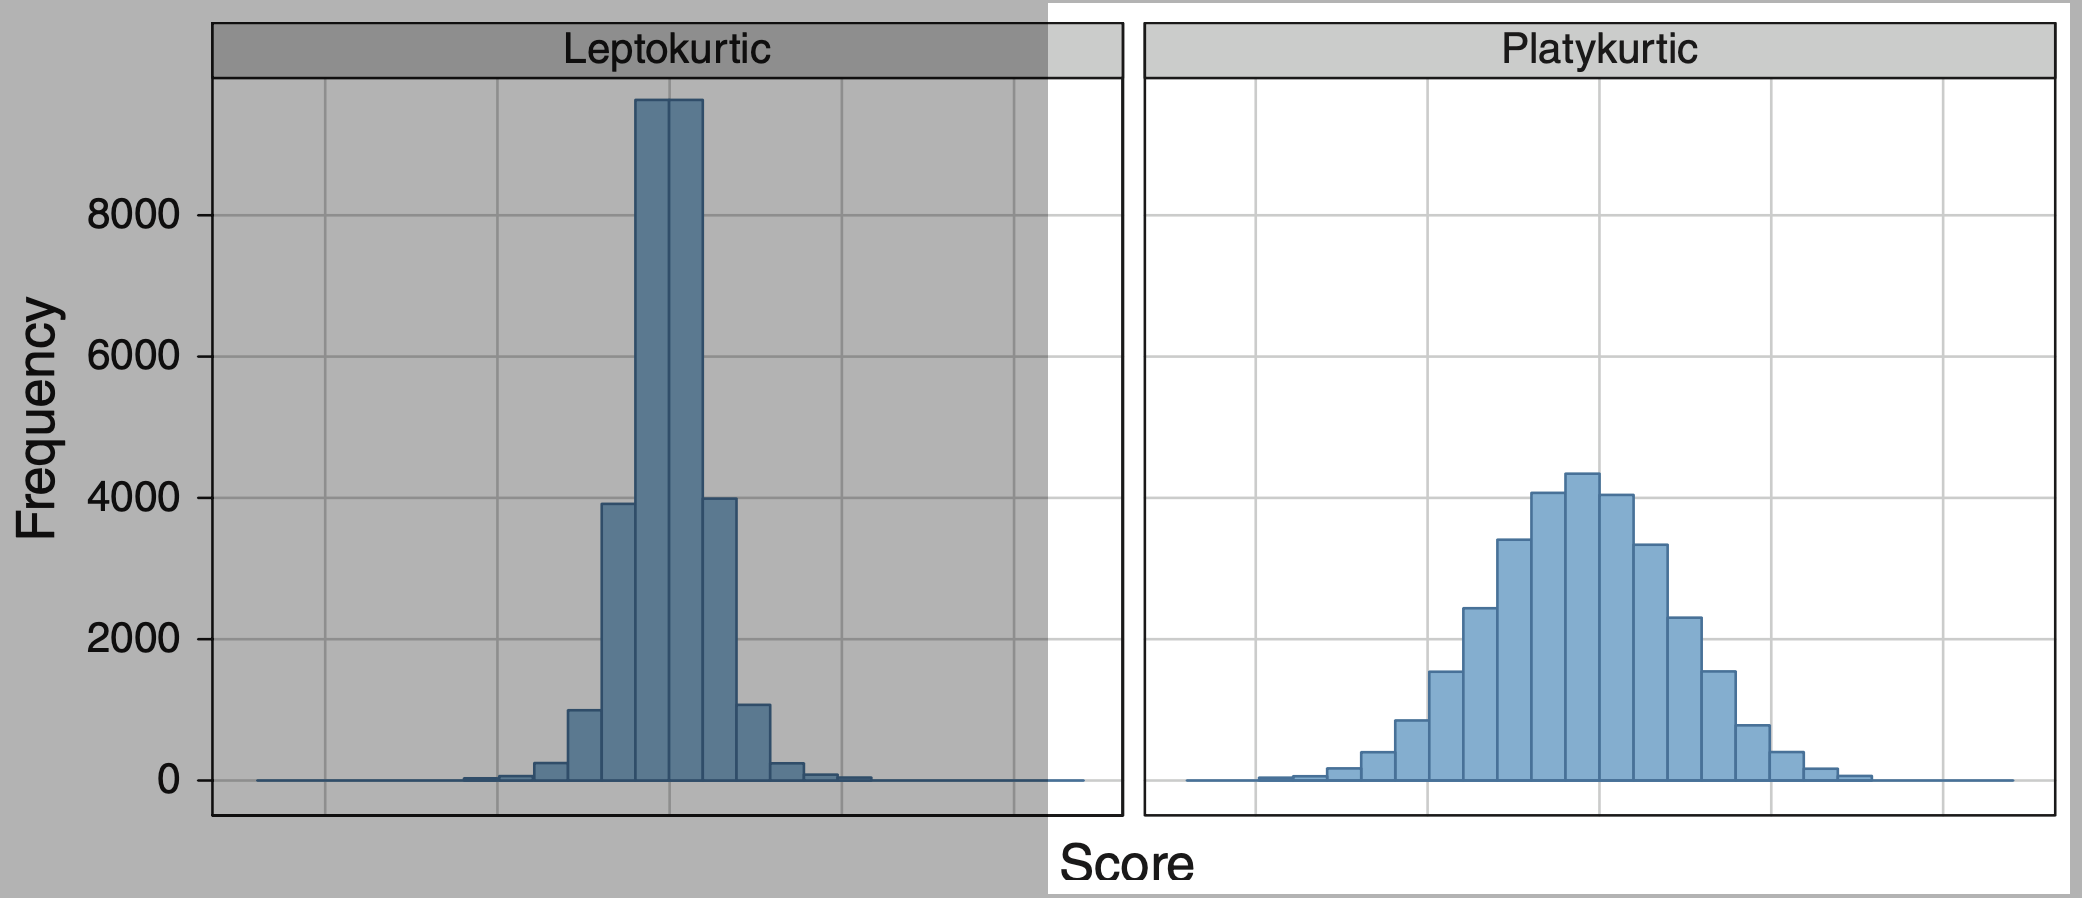
Kurtosis
Kurtosis measures the “tailedness” or sharpness of a distribution.
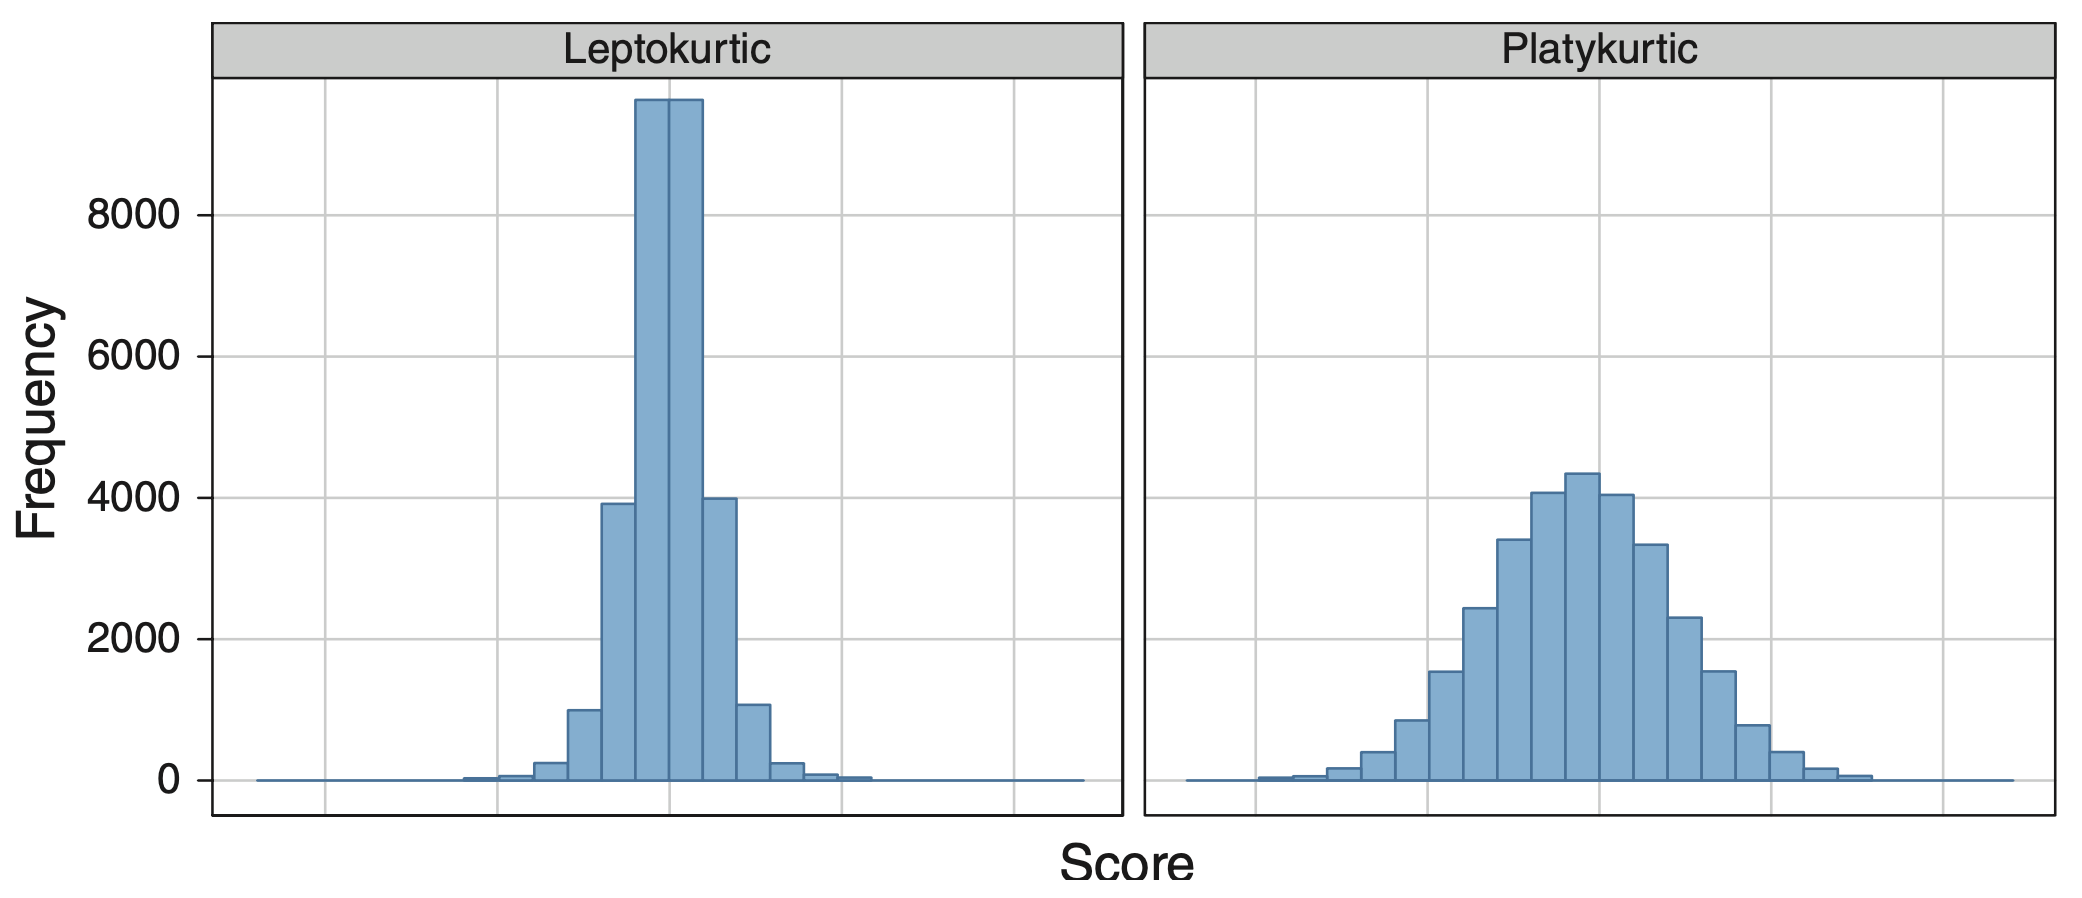
Leptokurtic
Heavy tails and sharp peak.
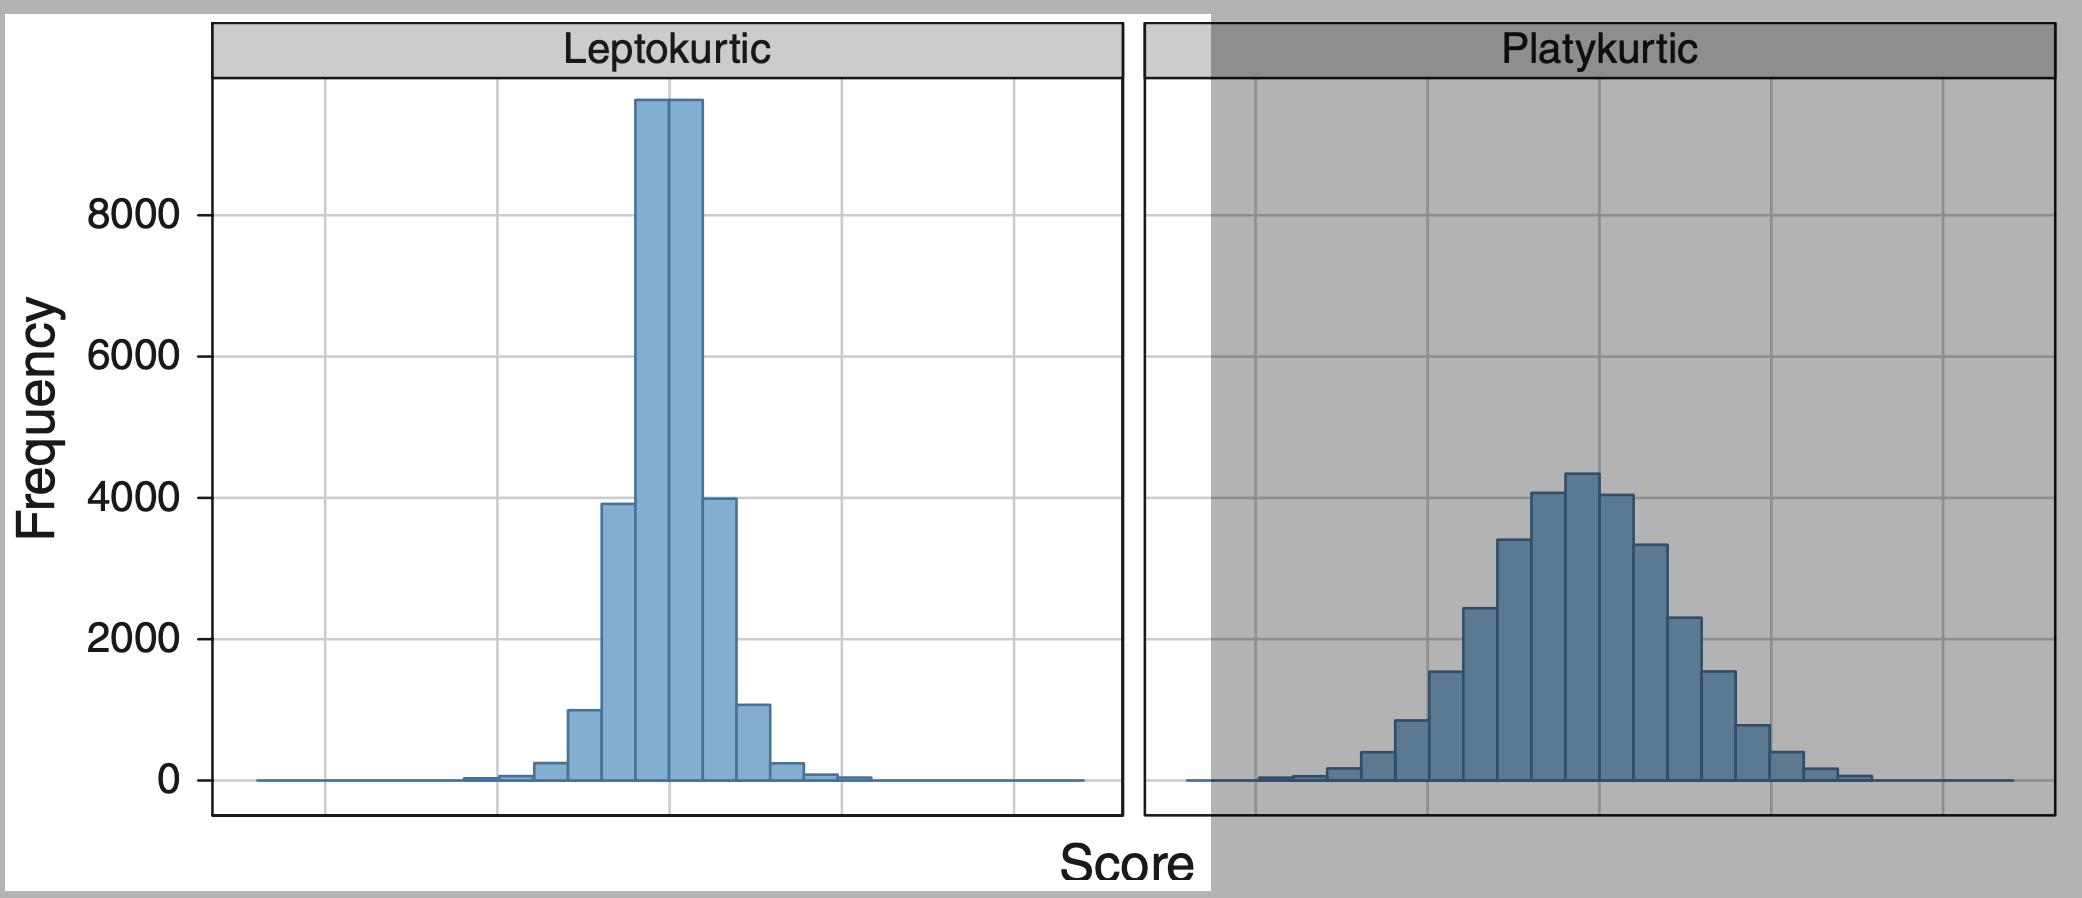
Platykurtic
Light tails and flatter peak.