Statistical Models
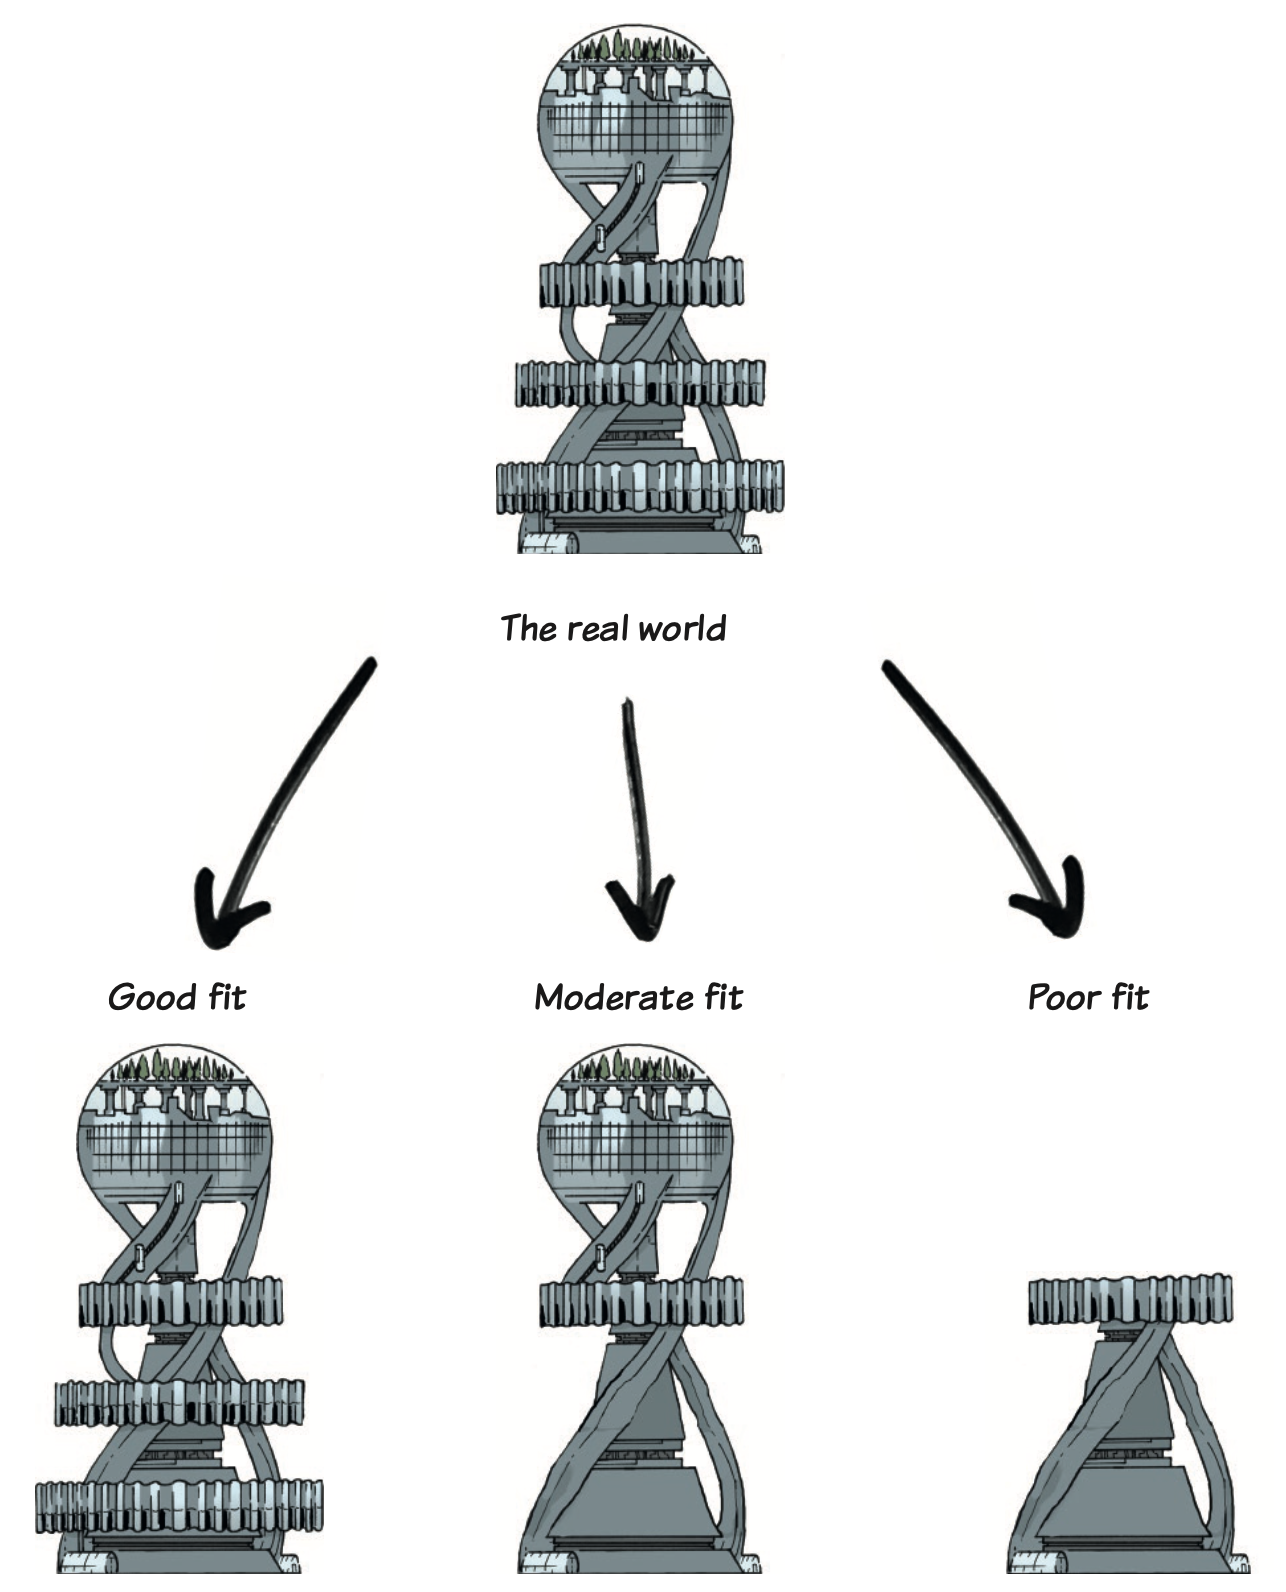
Statistical Models
A mathematical framework that represents relationships between variables in a dataset.
It is used to understand, explain, or predict outcomes based on observed data.
Statistical Model Consists:
Variables: Inputs (independent variables) and outputs (dependent variables).
Equations: Mathematical expressions defining the relationship.
Assumptions: Underlying rules about the data or process (e.g., normality, linearity).
The One and Only Statistical Model
\[ outcome_i = (model) + error_i \]
Simplest Possible Model
\[ outcome_i = (b_0) + error_i \]
\(b\), Greek symbol represents beta (\(\beta\)).
\(b_0\) means we are predicting the outcome from zero other variables, that is, just from a single parameter.
Parameters are estimated (usually) constant values believed to represent some fundamental truth about the relations between variables in the models.
Adding Variable to Statistical Model
\[ outcome_i = (b_0 + b_1X_1) + error_i \]
- A lot of time it is more interesting to see whether we can summarize an outcome variable by predicting from scores on another variable.
Understand Statistical Model
\[ outcome_i = (b_0 + b_1X_1) + error_i \]
\(i\) = particular entity.
\(outcome_i\) = outcome value for that particular entity.
\(X_i\) = score on the predictor variable.
\(b_1\) = predictor variable has a parameter attached to it which tells us something about the relationship between the predictor (\(X_i\)) and outcome.
\(b_0\) = is still there to tell us the overall levels of the outcome if the predictor variable was not in the model.
RAS Statistical Model
\[
outcome_i = (b_0 + b_1X_i) + error_i
\]
\[ relationship\;satisfaction_i = (b_0 + b_1length_i) + error_i \]
RAS Statistical Model
\(relationship\\satisfaction_i = (b_0 + b_1length_i + b_2effort_i) + error_i\)
We use the sample data to estimate the value of the model parameters, \(b\).
We use the sample data to estimate (best guess) what the population parameters are likely to be.
🤯 Your Turn
Calculate the mean value of these RAS values.
32, 30, 28, 30, 30, 29, 31, 29, 31
Your Turn: Answer
\[ \bar{X}=\frac{\displaystyle\sum_{i=1}^nx_i}{\displaystyle n} \\ = \frac{32 + 30 + 28 + 30 + 30 + 29 + 31 + 29 + 31}{9} \\ = \frac{270}{9} \\ = 30 \]
The Fit of the Mean
\[ outcome_i = model + error_i \]
\[ error_i = outcome_i - model \]
\[ error_i = RAS_i - \bar{X} \]
The Fit of the Mean: Week 1
\[ error_{week 1} = outcome_{week 1} - model \]
\[ error_{week 1} = RAS_{week 1} - \bar{X} \]
\[ error_{week 1} = 32 - 30 \\ = 2 \]
Error/Deviance/Residual
Deviance is the value of the outcome minus the value predicted from the model.
\[ error_{i} = outcome_{i} - model \]
\[ deviance_{i} = x_{i} - \bar{X} \]
References
![]()