Exploratory Data Analysis
Download & Install
✅ R Software, https://cloud.r-project.org/
✅ RStudio IDE, https://posit.co/products/open-source/rstudio/?sid=1
✅ Quarto, https://quarto.org/docs/get-started/
Your RStudio Project
✅ Created RStudio Project in your computer
✅ Created quarto document
Import Data
Data Structure
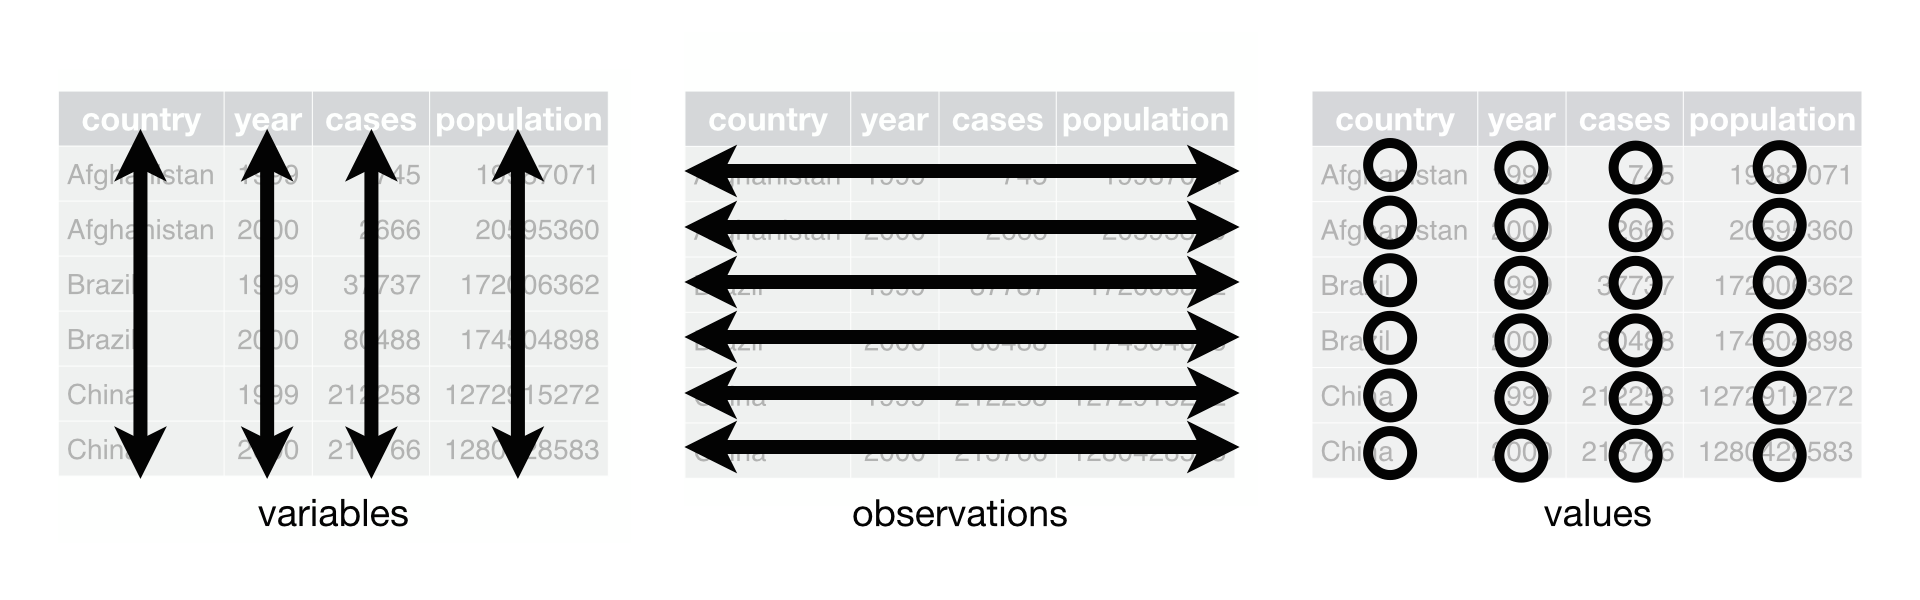
Column/Variable Types
| Data type | Example | Column header |
|---|---|---|
| logical | TRUE |
lgl |
| integer | 1L |
int |
| double | 1.5 |
dbl |
| character | "A" |
chr |
| factor | factor("A") |
fct |
| ordered | ordered("a") |
ord |
Step 1
install.packages("tidyverse")# Includes readr for importinginstall.packages("janitor")# For cleaning column namesinstall.packages("lubridate")# For date handling
library(tidyverse)
library(janitor)
library(lubridate)
Step 2. Basic CSV Import with read_csv()
df <- read_csv("path/to/file.csv")
Step 3. Understanding read_csv() Parameters
col_names: Specify if first row contains column namesskip: Skip rows at the beginningn_max: Read only first n rowsna: Specify what values should be treated as NAcol_types: Specify column types explicitly
Step 4. Cleaning Column Names
🤯 Problem: Column names with spaces, special characters, or inconsistent cases are hard to work with
Step 5. Converting Data Types
Convert character to factor
Convert character to date
Step 6. Working with Factors
Factors are categorical variables with defined levels
They’re useful for:
- Ensuring valid categories
- Controlling sort order
- Statistical modeling
Exporting Cleaned Data
Export to CSV
Export to Excel
Reading other File Formats
Excel files (requires
readxlpackage)SPSS, Stata, SAS files (requires
havenpackage)
Tips and Best Practices
- Use
read_csv()instead ofread.csv()- It’s faster and creates tibbles
- Better type detection
- Clean column names immediately
- Use
janitor::clean_names() - Consistent naming makes code easier
- Use
- Be explicit about data types
- Use
col_typesparameter - Convert to factors where appropriate
- Use
- Document your cleaning steps
- Comment your code
- Keep track of what you changed and why
EDA
Exploratory Data Analysis (EDA)
“how to use visualization and transformation to explore your data in a systematic way”
Data: penguins
Live on three island: Biscoe, Dream, & Torgersen.


Setup
- Install packages
install.packages("tidyverse")install.packages("palmerpenguins")
- Load libraries
library(tidyverse)library(palmerpenguins)
- Load the penguins dataset
data(penguins)
- Take a quick look
View(penguins)
Step 1. First Look at the Data
- Look at your data
- Understand what each column means
- Check the size of your dataset
Step 2. Understanding Data Dimensions & Structure
- How big is our dataset?
- What are the column names?
- What types of data do we have?
Step 3. Checking Data Quality
- Missing Values (NA)
- Duplicates
Step 4. Summary Statistics
Exploring Categorical Variables
Key Question: Which species live on which islands?
Step 5. Summary Statistics
- Exploring Numerical Variables
Step 6. Comparing Groups
- Average measurements by species
- Compare by sex
- Compare by species AND sex
Step 7. Visualization - Distributions
- Visualizations help us SEE patterns in data
- Distributions: how values are spread out
Step 8. Visualization - Comparing Groups
Step 9. Visualization - Relationships between Variables
- One of the most important questions in EDA:
- How do variables relate to each other?
Step 10. Correlation Analysis
- Correlation measures how strongly two variables are related
Step 11. Finding Outliers
Outliers are observations that are very different from others They can be:
- Errors in data collection
- Rare but real observations
- Important discoveries!
Answering Research Questions
EDA is about asking and answering questions!
QUESTION: Size difference between sexes?
QUESTION: Do penguins on different islands have different sizes?
QUESTION: Are bill dimensions related to body size?
QUESTION: Has penguin size changed over the years?
![]()