Measures of Dispersion
Dispersion
How spread out the data is around its mean.
Measures of Dispersion
Range: The difference between the maximum and minimum values.
Variance: The average of the squared differences from the mean.
Standard Deviation (SD): The square root of variance, representing average deviation from the mean.
Interquartile Range (IQR): The difference between the 75th percentile (Q3) and 25th percentile (Q1).
Total Error/Deviance/Residual
Add up the deviances for each data point
\[ total\;error = \displaystyle\sum_{i=1}^n (outcome_{i} - model_i) \]
\[ total\;deviance = \displaystyle\sum_{i=1}^n (x_{i} - \bar X) \]
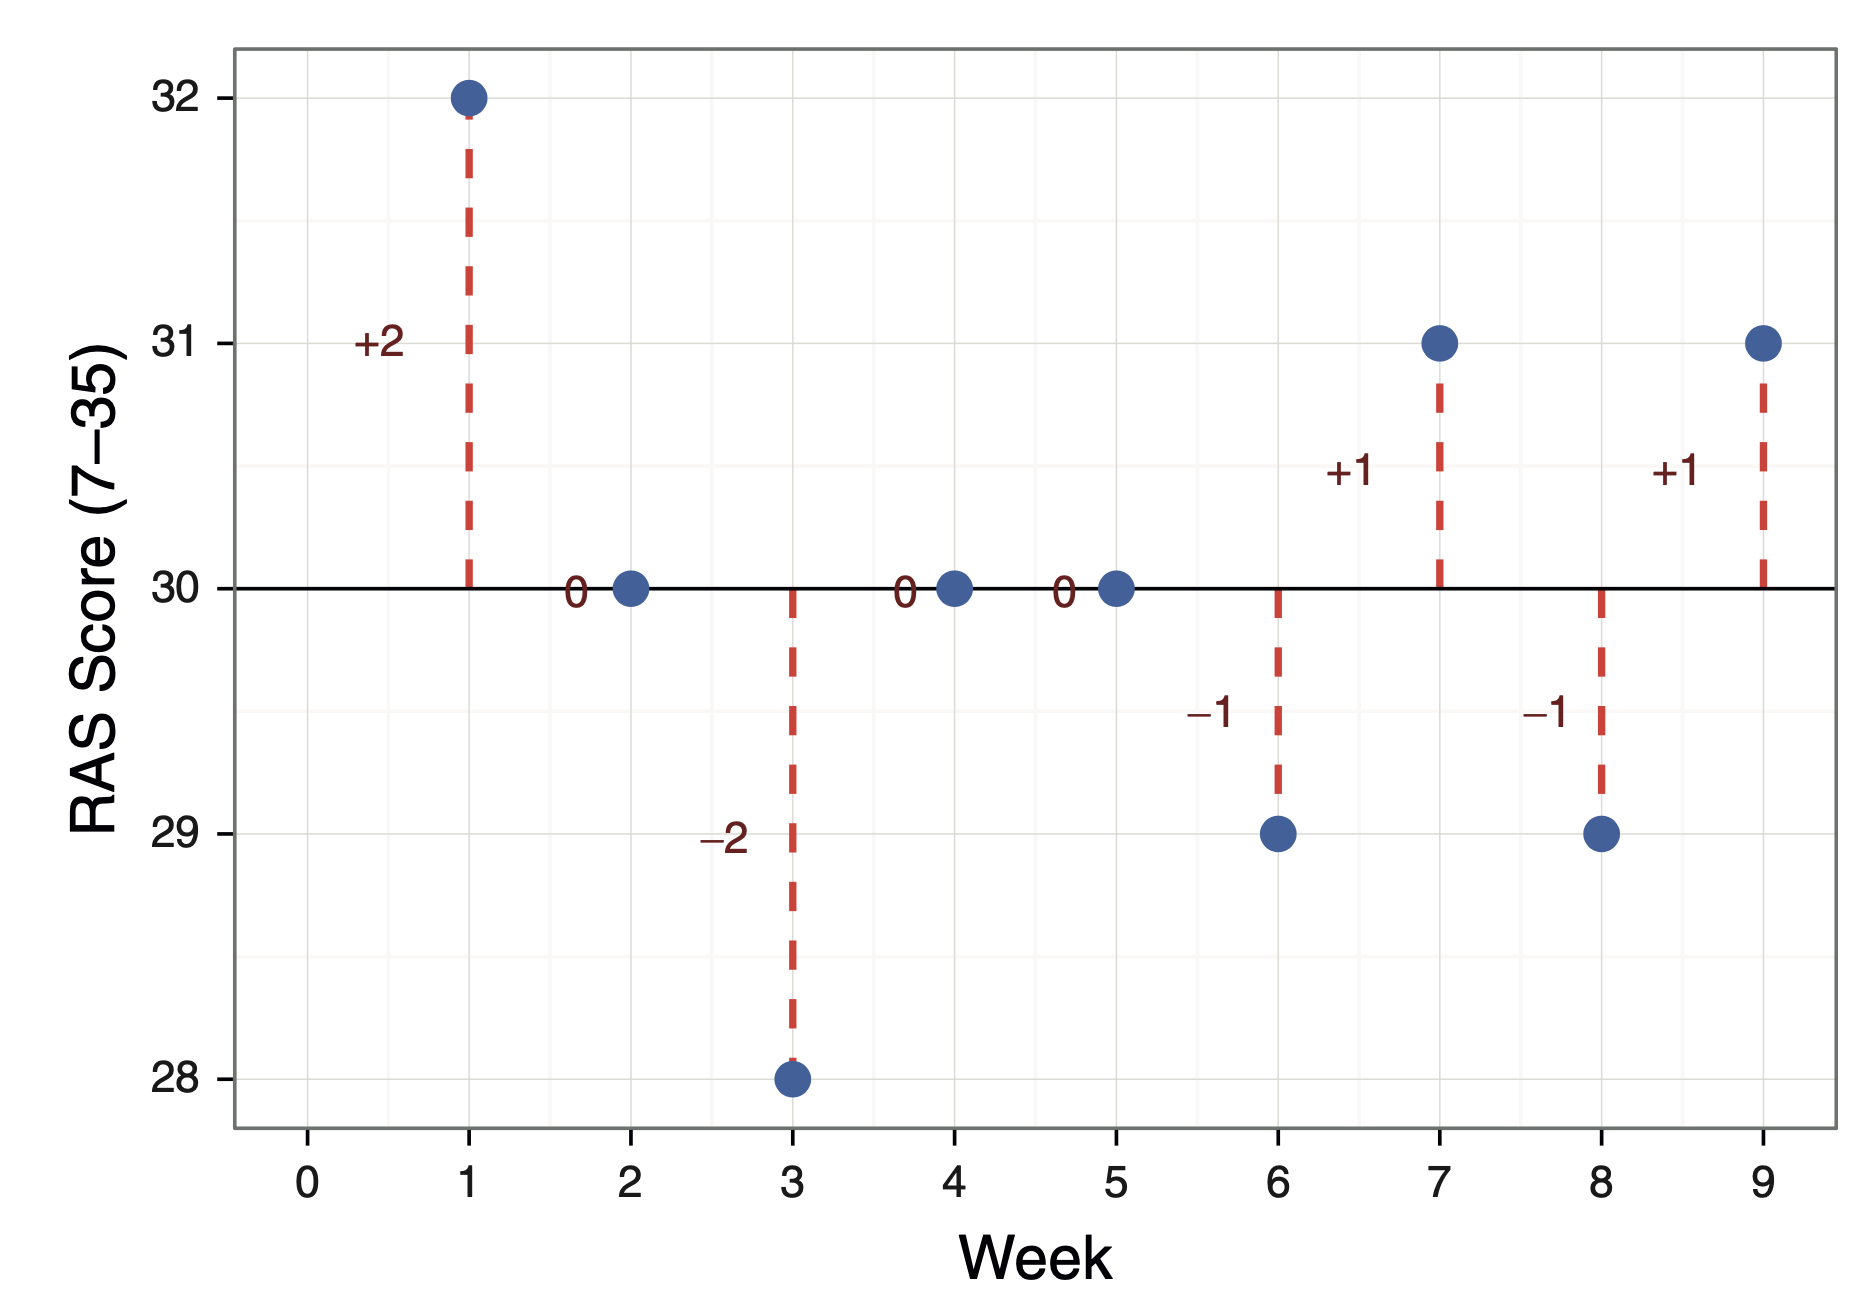
Sum of Errors
\[ Sum \; of \;errors = \displaystyle\sum_{i=1}^n (outcome_{i} - model_i) \]
\[ = (28-30) + (29-30) + (29-30) + (30-30) \\+ (30-30) + (30-30) + (31-30) + (31-30) + \\(32-30)\\ = -2 + (-1) + (-1) + 0 + 0 + 0 + 1 + 1 +2 \\ = 0 \]
Graph RAS Errors
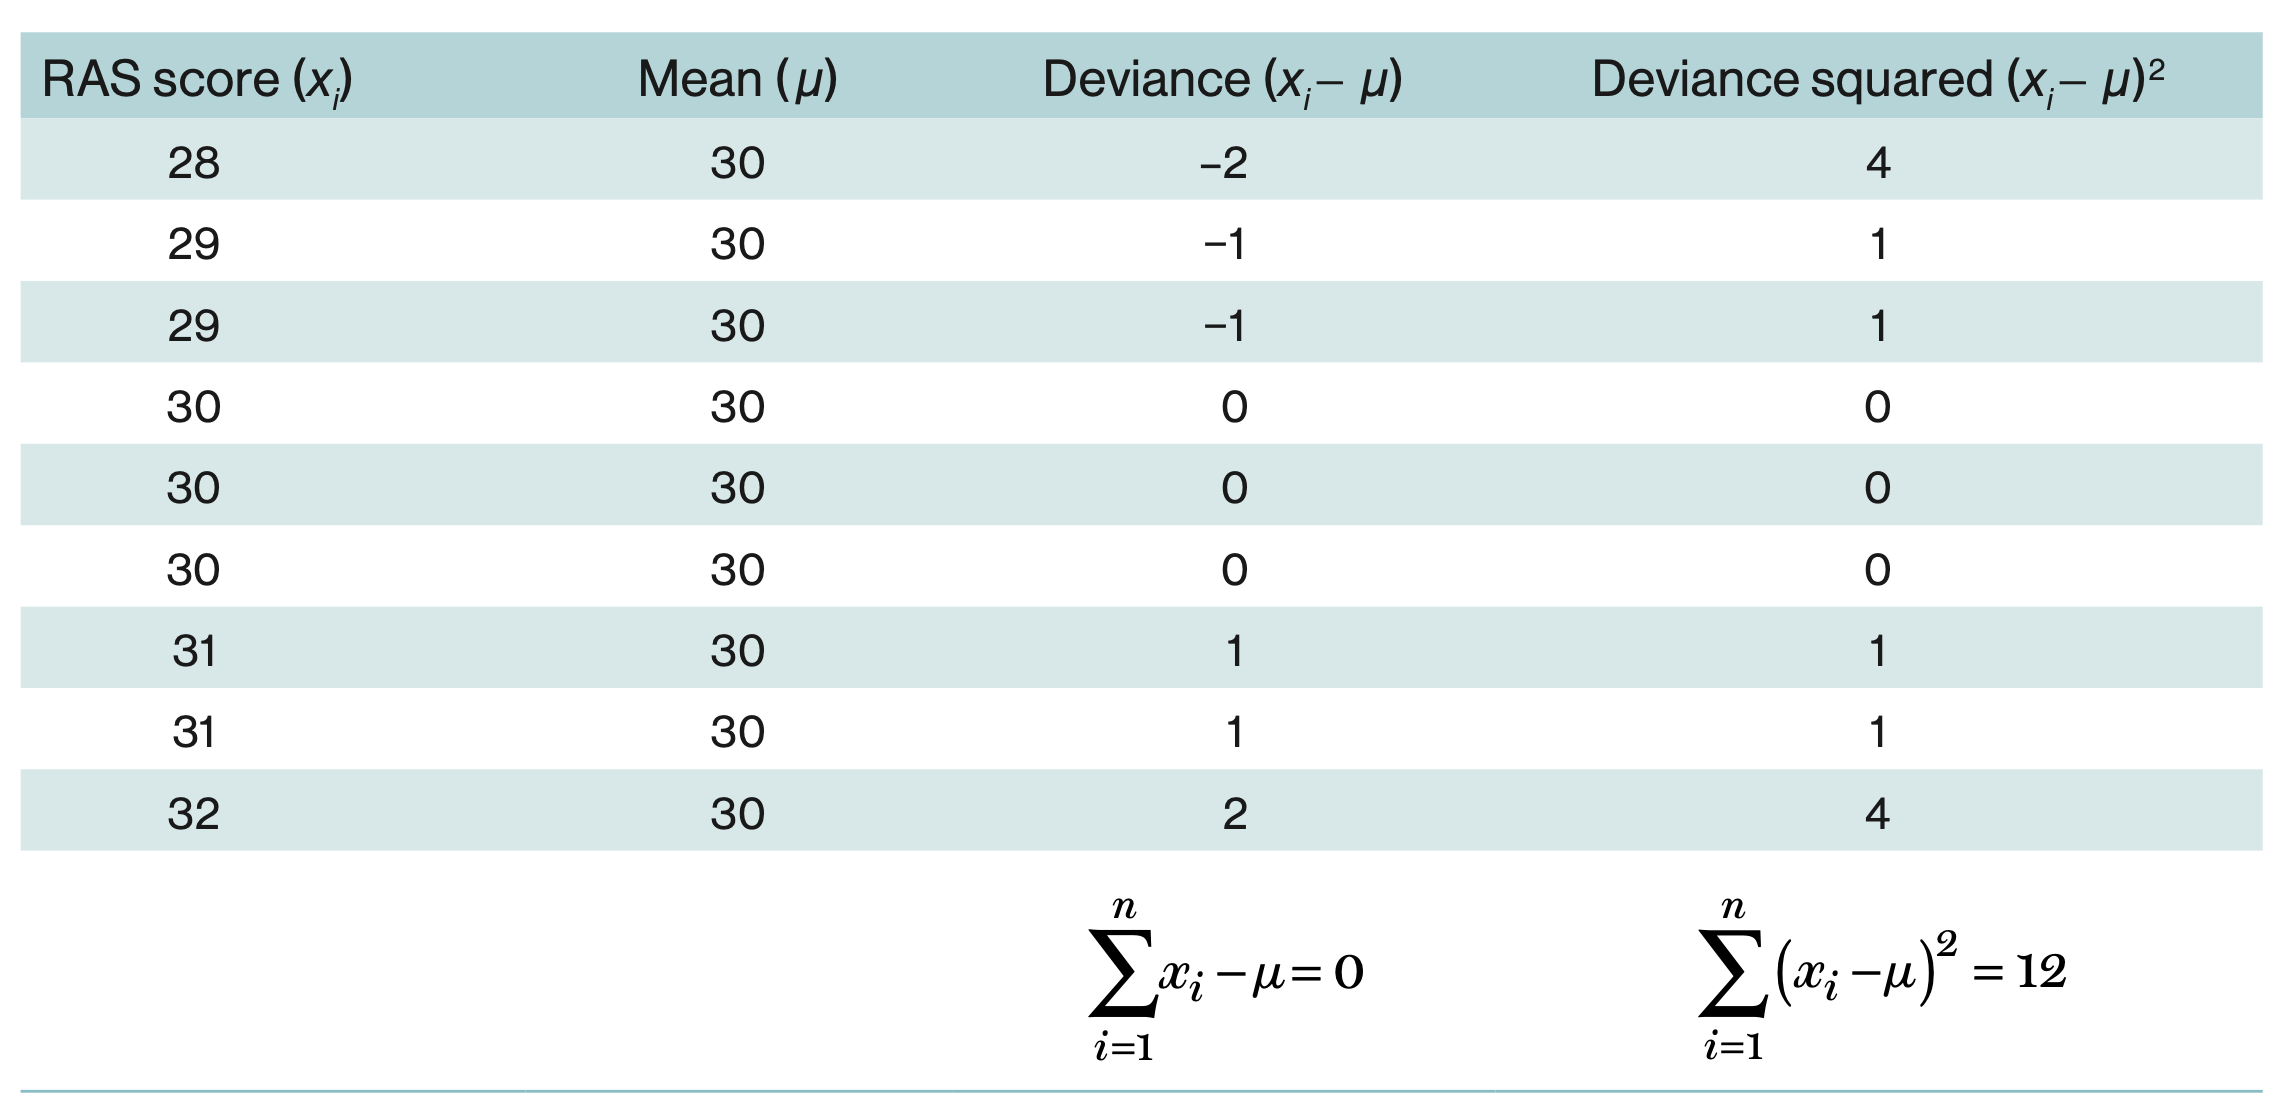
Sum of Squared Errors
\[ Sum \; of \; squared \;errors (SS) = \displaystyle\sum_{i=1}^n (outcome_{i} - model_i)^2 \]
\[ Sum \; of \; squared \;errors (SS) = \displaystyle\sum_{i=1}^n (x_{i} - \bar{X})^2 \]
Sum of Squared Errors
Sum of Squared Errors (\(SS\))
❌ Size of \(SS\) depend on how many scores we have in the data.
❌ It is nuisance if we want to compare the total error across samples of different size.
✅ An easy solution is to divide \(SS\) by the number of scores/observations (\(N\)).
Variance
\[ mean \; squared \;error = \frac{SS}{N} = \frac{\displaystyle\sum_{i=1}^n (outcome_{i} - model_i)^2}{N} \]
\[ variance (\sigma^2) = \frac{SS}{N} = \frac{\displaystyle\sum_{i=1}^n (outcome_{i} - model_i)^2}{N} \]
The symbol of variance in sample is \(s^2\).
The symbol of variance in population is \(\sigma^2\).
RAS Variance
The average error of the mean was 1.33 RAS units squared
\[ variance (\sigma^2) = \frac{SS}{N} = \frac{\displaystyle\sum_{i=1}^n (outcome_{i} - model_i)^2}{N} \\ = \frac{12}{9} \\ = 1.33 \]
Standard Deviation
\[ \sigma = \sqrt{variance} = \sqrt\frac{\displaystyle\sum_{i=1}^n (outcome_{i} - model_i)^2}{N} \\ = \sqrt\frac{12}{9} \\ = \sqrt{1.33 } \\= 1.15 \]
Degrees of Freedom
\[ \sigma = \sqrt{variance} = \sqrt\frac{\displaystyle\sum_{i=1}^n (outcome_{i} - model_i)^2}{N - 1} \\ = \sqrt\frac{12}{8} \\ = \sqrt{1.5} \\= 1.22 \]
Outliers and Variance
The variance with the outlier is 37.43
The variance without the outlier is 1.5
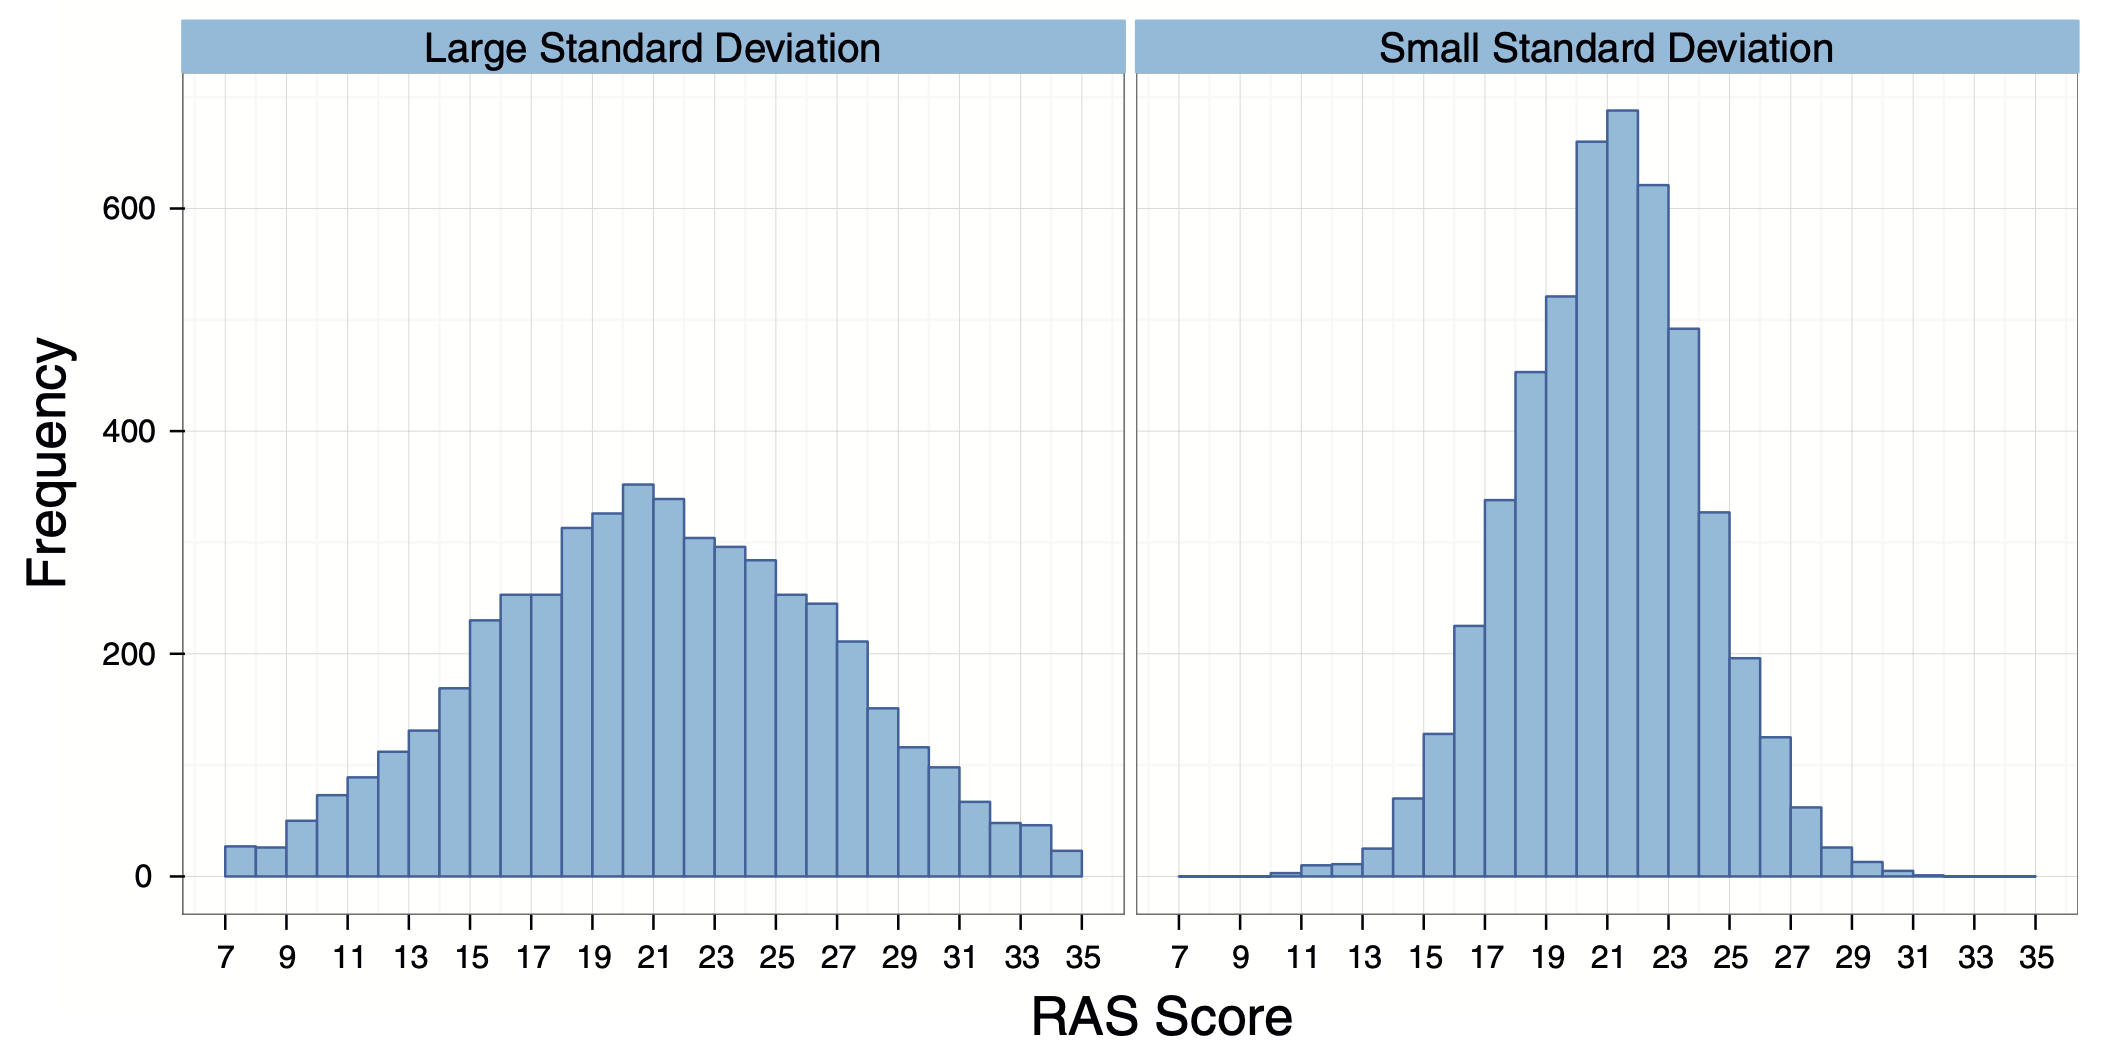
Standard Deviation and Dispersion
A small standard deviation (relative to the value of the mean) indicates that data points are close to the mean.
A large standard deviation (relative to the mean) indicates that the data points are distant from the mean.
A standard deviation of 0 would mean that all of the scores were the same.
Same Mean, Different SD
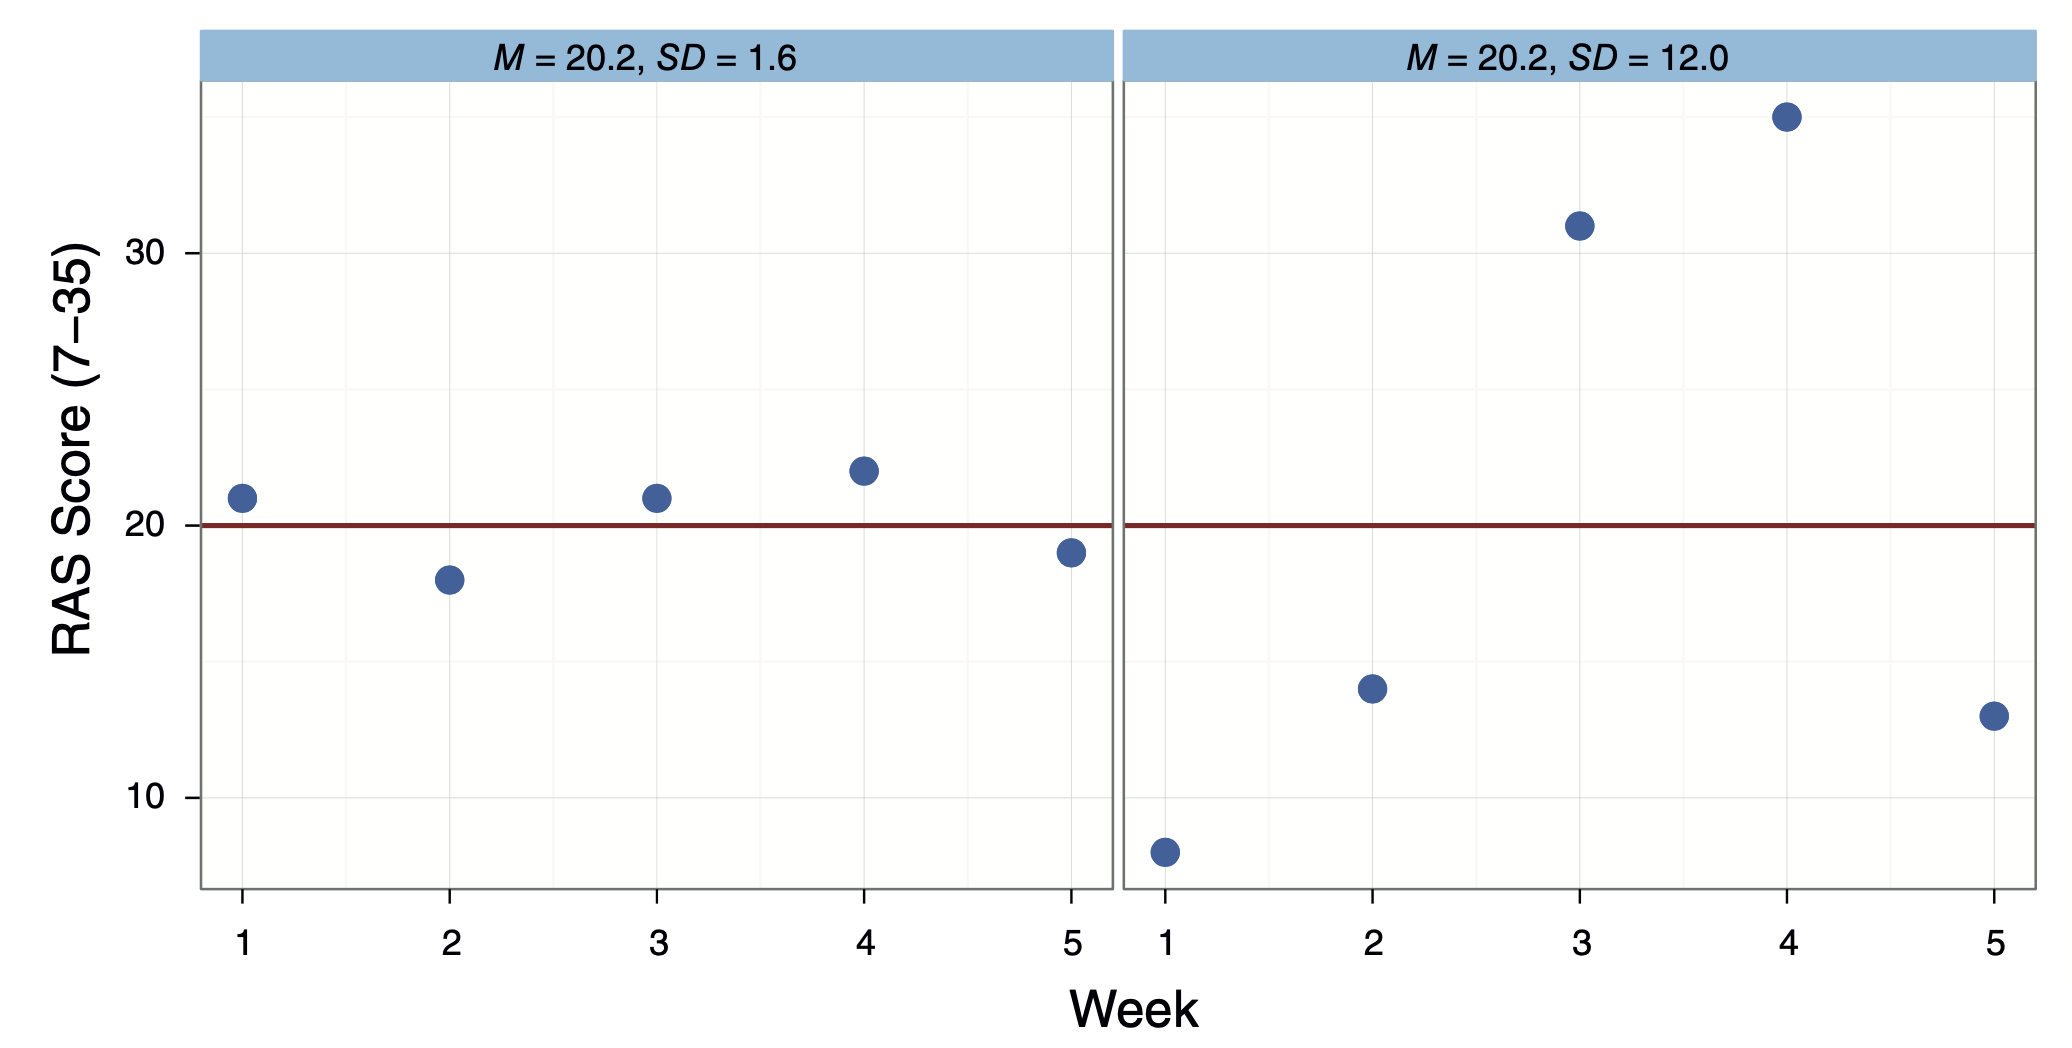
Same Mean, Different SD
![]()